100 concurrent users means 100 requests in flight at once, which is almost always a much smaller number than the people clicking at the same instant, your signup count or your daily actives. The number that decides whether your app holds up is requests per second multiplied by how long each request holds a resource: a database connection, a CPU core, a block of memory, or a realtime socket.
“It was fine yesterday” can be completely accurate. A solo test sends one request at a time against a tiny dataset. A launch sends overlapping requests against accounts that have started to accumulate real records. If the people hitting it are already paying you, containment comes before diagnosis.
An AI-built app does not have a universal 100-user limit. A stall around that point usually means one resource grows with concurrency or data: database connections, queries per request, rows scanned, response size, a third-party API, or CPU work. The number 100 describes the test load, not the app’s fixed capacity.
Across the 21 third-party apps AxonBuild audited in June and July 2026, Performance & Scale averaged 53.3 out of 100. That historical score explains why a controlled load test belongs in the launch process, even though it does not measure how often any single performance bug occurred: performance assumptions need evidence at the traffic and data volume the app expects.
Find which limit you are hitting
Start with the symptom. Changing infrastructure before identifying the constrained resource can make the graph look better without fixing the request path. The timing of a single request path is the per-request half of the same measurement.
| What you observe | What to inspect first |
|---|---|
| Database connection errors or long waits before a query begins | Connection method, pool size, client count, and connection lifetime |
| Query count rises with the number of rows on the page | N+1 relation loading |
| One query gets slower as a table grows | EXPLAIN plan, filters, joins, and indexes |
| Response bytes and duration grow together | Selected columns, page size, and pagination |
| Database metrics stay calm while requests slow down | Application CPU, external APIs, queues, and rate limits |
Record request latency, error rate, database connection count, query count, and response size during the same run. Those five measurements separate the common database cases from a slow payment provider, an overloaded image job, or application code doing expensive work.
Turn users into requests before you size anything
An app is sized against requests per second and how long each request holds a resource, never against a user count. Three lines of arithmetic get you from one to the other.
- Users to requests per second: active users x actions per minute x requests per action, divided by 60.
- Requests in flight: requests per second x average response time in seconds. This is Little’s Law, and it estimates the mean number of requests competing for connections and memory.
- Resources held: requests in flight x the resource each request holds for its whole life.
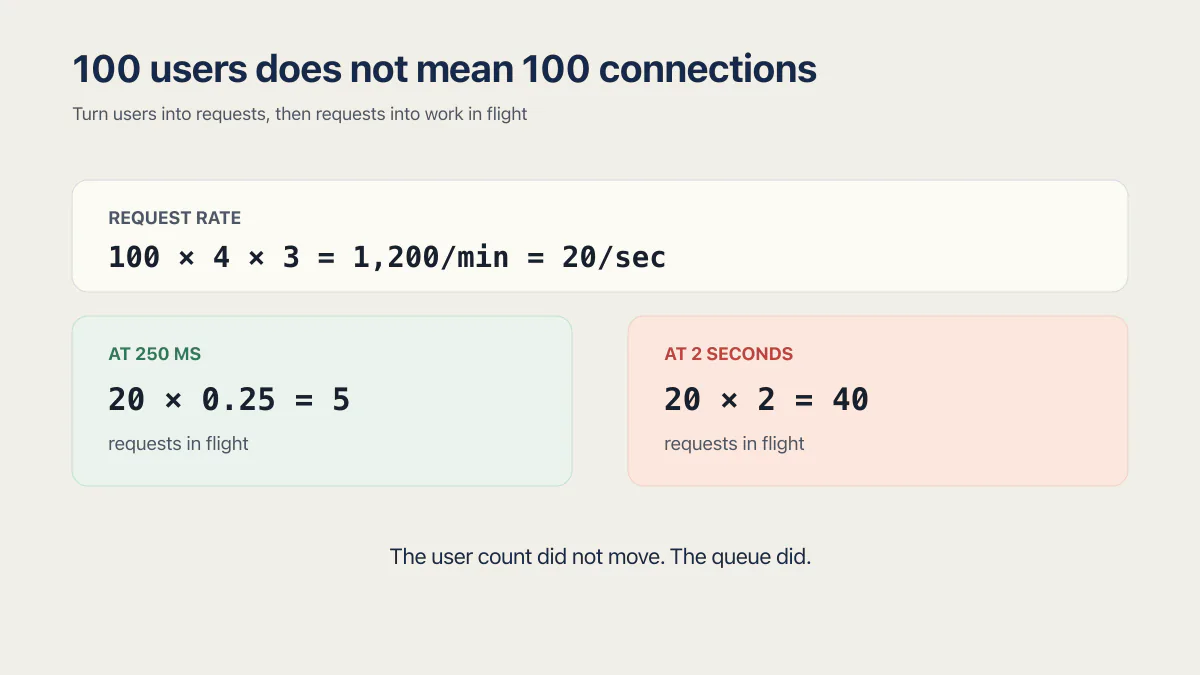
A worked example. 100 active users, each taking 4 actions per minute, each action firing 3 requests, is 1,200 requests per minute, or 20 requests per second. At a 250 ms average response time, that is 20 x 0.25 = 5 requests in flight. If every request holds one database connection from start to finish, the app needs about 5 connections, not 100.
Now break it. Let one endpoint slow to 2 seconds and the same 20 requests per second put 40 requests in flight. The user count did not move. The queue did. That is why response time, not signups, is the variable that turns a comfortable app into a stalled one, and why a small regression compounds instead of adding.
Three caveats, because the arithmetic is a starting point and not a guarantee:
- A single request may run several queries, so requests in flight and queries in flight are different numbers.
- With transaction pooling, a connection is held only for the duration of a transaction, not the whole request, so the connection count can be far lower than the requests-in-flight figure.
- Keep mean response time in the Little’s Law calculation. Test p95 and p99 separately against bursts and slow endpoints. Tail latency can fill a pool even when mean concurrency fits.
Do the arithmetic before you change anything. It tells you whether you are 5 connections into a 60-connection ceiling (your problem is elsewhere) or 400 into it (your problem is exactly where you think it is).
Which ceiling your platform hits first
The generic advice (“add a pooler, add an index”) assumes a stack. AI-built apps sit on very different ones, and each hits a different wall first.
| Where the app runs | What usually saturates first | Where to look |
|---|---|---|
| Lovable app on Lovable Cloud, or on a connected Supabase project | The Data API path and the default row cap on unbounded selects, not a hand-written connection string | PostgREST and database metrics, rows returned per request |
| Base44 app on its built-in managed backend | The managed database and platform quotas you do not configure | Queries and response bytes per request, then the platform’s own limits |
| Bolt or Replit app on an autoscale deployment | Per-instance concurrency and cold starts when the service scales from zero | Instance count, cold-start rate, the maximum-servers setting |
| Any app behind Vercel Functions | Burst concurrency at the platform, then database connections held by short-lived instances | Function throttling errors, pooler mode, connections per invocation |
| Plain Node backend on a single VPS | Process memory and file descriptors inside one process | Resident memory per process, ulimit -n, event-loop lag |
Two of those ceilings are worth naming precisely. Replit Autoscale deployments scale down to zero when idle and back up under load, with a configurable maximum number of servers, so a cold start is part of your p95 rather than an anomaly (Replit’s deployment types docs, verified 29 August 2026). Vercel Functions scale automatically, with a burst limit of 1,000 concurrent executions per 10 seconds per region and a maximum of 30,000 concurrent functions on Hobby and Pro; past that you get a 503 FUNCTION_THROTTLED (Vercel’s concurrency scaling docs, verified 5 August 2026).
Serverless has a second-order effect on the database. Many short-lived instances each opening their own connection can exhaust a pool that a single long-lived server would never have troubled, which is the whole reason transaction-mode pooling exists. On AWS, Lambda concurrency has its own page: how it is calculated, the account quota and timeout, and why the database is often the first limit a serverless app hits.
Connection pressure: Data API and Postgres clients are different paths
The connection-cliff advice applies when your application opens native Postgres connections. It does not mean every browser request made with supabase-js creates a new direct database connection. Supabase’s Data API sits in front of Postgres and manages its own database pool.
For a backend that uses a Postgres driver or ORM, the connection method matters. As verified 2 August 2026, Supabase recommends:
- a direct connection for migrations, backup tools, and suitable long-lived backends;
- Shared Pooler session mode for persistent clients that need IPv4;
- Shared Pooler transaction mode on port
6543for serverless or edge workloads.
The current matrix and exact project-specific strings live in Supabase’s database connection guide. Copy the connection string from the project’s Connect panel instead of reconstructing the host by hand.
A Nano or Micro compute instance lists 60 maximum database connections and 200 pooler clients in Supabase’s compute limits (verified 5 August 2026). Those numbers are resource ceilings, not promises that 60 concurrent HTTP requests will succeed or that request 61 will fail. Supabase services consume database connections too, a request may run several queries, and transaction pooling can let many clients share fewer database connections when their transactions do not overlap.
Read the error string, it names the ceiling
The exact message tells you which limit you hit, and they are not the same limit:
FATAL: sorry, too many clients already. PostgreSQL refused the connection becausemax_connectionsis full. You are on the direct-connection path and you have too many open connections, not necessarily too much traffic.remaining connection slots are reserved for .... Same ceiling, hit while PostgreSQL was holding back its reserved slots. The tail of that message differs by PostgreSQL version, so match on the first half.Max client connections reachedfrom Supavisor. This is the pooler’s client limit, not the database’s. Supabase documents it in the Supavisor guide as connections above your compute add-on’s allowance. Raising databasemax_connectionsdoes nothing here.503 FUNCTION_THROTTLEDon Vercel. Platform concurrency, upstream of the database entirely.- A 502 or 504 from nginx, a load balancer, or a platform proxy. A 504 usually means the app never answered inside the proxy’s timeout; a 502 can also mean the process refused or reset the connection or returned something the proxy could not parse. Read the upstream log and the request timing first: if the slow part is a query, the database is still the bottleneck, and if the process was busy or absent, the queue is in front of it.
The first three are database-shaped. The last two are usually queue-shaped, and a bigger database will not touch them unless the upstream timing shows the wait was a query.
Check the application’s actual path before changing it:
- If the code calls the Supabase Data API, inspect PostgREST and database metrics rather than searching for an application connection string.
- If a serverless function uses Prisma,
pg, SQLAlchemy, or another Postgres client, confirm it uses the pooler mode intended for transient clients and has a bounded client-side connection limit. - Inspect
pg_stat_activityor the dashboard connection chart during a load run. A rising connection count with idle sessions points to a different problem from a flat pool whose queries are slow. - Re-run the identical workload after the connection change. A lower connection count is useful only if latency and error rate also improve.
The connection cliff waits for your best traffic day, the one day you can least afford to meet it.
Connection exhaustion can also produce timeouts that a handler mistakenly turns into success. That response-contract failure is covered in when an app fails silently and says 200 OK.
Realtime connections are a separate ceiling from your API
If the app has a chat, a live dashboard, presence indicators, or any “updates without refresh” feature, it has a second capacity limit that has nothing to do with the database pool. A realtime socket stays open for the whole session. A REST request holds a resource for 250 ms. One user can therefore cost one realtime connection all day while costing almost nothing on the API path, which is why a live feature usually saturates first.
Supabase Realtime publishes per-plan quotas. As verified 5 August 2026, its Realtime quotas list 200 concurrent connections, 100 messages per second, and 100 channel joins per second on Free; 500 of each on Pro with the spend cap on; and 10,000 concurrent connections with 2,500 messages per second on Pro without the spend cap and on Team. Channels per connection is capped at 100 across those plans.
Read those three numbers together, because the one you breach first is rarely the one you expected:
- Concurrent connections is roughly your simultaneously-open browser tabs, not your user count. Someone with three tabs open costs three.
- Messages per second is the whole project’s fan-out, not per client. A broadcast to 200 subscribers is 200 messages, so a single busy table can spend the budget on its own.
- Channel joins per second bites at page load, not at steady state. A component that subscribes on mount, across a burst of arrivals, is a join spike.
The fix is subscription scope, not a bigger database. Subscribe to the narrowest filter that serves the screen instead of a whole table. Share one channel across components rather than opening one per component. Unsubscribe on unmount so a navigating user does not accumulate sockets. Push high-frequency, low-value updates (typing indicators, cursor positions) through throttled broadcast instead of database change events. Upgrading compute moves the database ceiling and leaves every realtime quota exactly where it was.
N+1 queries: one page creates one query per row
An N+1 query starts with one query for a list, then performs another query for every item. Ten orders can cause eleven round trips. A thousand orders can cause 1,001.
const orders = await db.order.findMany({ where: { userId } });

for (const order of orders) {
  order.customer = await db.customer.findUnique({
    where: { id: order.customerId },
  });
}
The reliable test is query count, not how tidy the ORM code looks. Enable query logging for the test environment, load a page with 10 records and then 100, and compare the count. If the count grows with the rows, load the relation with a join or batch the related IDs in one query. Prisma documents include, in, and relationLoadStrategy: "join" in its N+1 query guidance; the correct option depends on the ORM version and query shape in the app.
The same page that was fast at 100 rows is slow at 10,000
This is the failure that arrives with no new users at all. Traffic never moved; the table grew. People search for it as a user problem because a busy day is when they noticed it, but the variable that changed was row count, and more compute does not make a query that reads 10,000 rows read fewer of them.
Two checks narrow the investigation in about ten minutes. Load the slow page as a single user against today’s data. If one request is slow on its own, concurrency is not required to reproduce the problem. Then compare the row count of the table behind that page with roughly what it held when the page still felt fast. A table that went from hundreds to tens of thousands while request volume stayed flat makes a scan or an unbounded read worth testing. It does not rule out application CPU, a queue, an external call, or an oversized response. Record dependency timing, query and connection counts, CPU and memory, queue wait, external-call duration, and response size before naming the constrained resource.
Missing indexes: prove the scan before adding one
PostgreSQL automatically indexes primary keys and unique constraints. A foreign-key declaration does not automatically create an index on the referencing column. PostgreSQL’s constraint documentation explains why: an index on the referencing side is often useful, but it is not always the right index.
That nuance matters. An unindexed filter does not guarantee a full-table scan on every execution, and an index does not guarantee PostgreSQL will use it. The planner may prefer a sequential scan for a small table or a query that returns much of the table.
Use EXPLAIN (ANALYZE, BUFFERS) on a safe staging copy with realistic data. If a frequent selective lookup on orders.customer_id reads far more rows than it returns, an index such as the following may be appropriate:
create index concurrently if not exists orders_customer_id_idx
  on orders (customer_id);
CREATE INDEX CONCURRENTLY avoids blocking writes for the full build, but PostgreSQL does not allow it inside a transaction block. Confirm the new plan and write cost after the index is built. An unused index still consumes storage and adds work to inserts and updates.
Oversized reads: choose the page and the columns
select('*') and missing pagination are separate decisions. Selecting every column makes each row wider. Omitting a range or limit lets the result grow until a server-side cap stops it.
Supabase projects return at most 1,000 rows by default through the Data API, and the setting is configurable in the project’s API settings (verified 5 August 2026). Supabase recommends keeping the cap low and using range queries in its select reference. Treat that cap as a guardrail, not pagination: fetching 1,000 wide rows for a screen that shows 20 still wastes database work, transfer, and browser memory. What the browser itself measures, the front-end vitals, is the layer this page leaves out.
const { data, error } = await supabase
  .from("orders")
  .select("id,status,total_cents,created_at")
  .order("created_at", { ascending: false })
  .range(0, 49);
For changing datasets, use a stable sort and a cursor when duplicate or missing rows between pages would matter. Offset or range pagination is often enough for an admin table; an activity feed under frequent inserts usually needs a cursor.
I met the cleanest version of this in one of the audits, a Q&A platform. The hook that loaded questions fetched the entire table with no limit, and three of the app’s hottest pages reused that same hook. What stayed with me was the pagination component sitting in the same codebase, built, wired to nothing. The app had the fix on the shelf and shipped the unbounded query anyway. I still don’t know what the generator was responding to when it built that component; no code ever asked for it.
Caching: when it raises the ceiling and when it hides the bug
Caching is the first lever most founders reach for, and it is the one most likely to be pulled for the wrong reason. It is a real capacity multiplier in exactly one situation: many requests asking for the same bytes.
Where it genuinely raises the ceiling:
- Public reads behind a CDN. A marketing page, a public listing, a product catalogue. Set
Cache-Controlon the response and the request never reaches your app, so it costs zero connections. - Repeated identical queries. A reference table, a settings blob, a leaderboard that can be a few seconds stale. A short server-side cache turns thousands of reads into one.
- Client-side query caching. A data-fetching layer that dedupes in-flight requests and reuses recent results stops one page from firing the same query five times because five components asked for it.
- Compression. Gzip or Brotli on JSON responses cuts transfer time on the oversized-read path, though it does not reduce the database work behind it.
Where it hides the bug: put a cache in front of an N+1 query or an unbounded select and the cost does not disappear, it moves. It moves to the first uncached request, which is now your worst request and lands on a real user. It moves to every cache miss after a deploy, when the whole cache is cold at once. And it moves to every write path, because a table that changes often invalidates constantly, so the cache hit rate collapses precisely when traffic is highest.
The test is simple. If the cached thing is genuinely the same for many users and can tolerate being slightly stale, caching is the answer. If it is per-user data that changes on every write, caching is a delay on a bill you still have to pay; per-user reads that repeat unchanged can still be cached safely, keyed by user and cleared on write, as long as nothing leaks across users. Fix the query first, then cache the result if it still helps. How to expire, invalidate and key each layer so customers stay apart is covered in caching strategies web applications can use safely.
Run a controlled load test
Run the test against staging with production-like data. A separate environment prevents test traffic and test writes from contaminating customer data; one database with no staging explains the deployment risk behind that boundary.
Write down the pass mark before you run anything. Most guides hand you a universal target number; there isn’t one, so set your own and set it in advance. Something like “p95 under 800 ms and error rate under 0.5% at 20 requests per second” is a threshold you can pass or fail. “Feels fast” is not. The k6 load testing example shows a script with thresholds that fail the run, plus the CI job that runs it.
- 01 Pick one important read path and one important write path. Define what a successful response means for each, and write down the p95 latency and error rate you are willing to accept.
- 02 Seed realistic row counts and account shapes, including one account with much more data than the median.
- 03 Ramp traffic instead of jumping straight to 100 concurrent workers. Record the point where latency or errors leave the acceptable range.
- 04 Capture p50, p95, and p99 latency, error rate, query count, connection count, response bytes, CPU, and memory during the run.
- 05 Change one suspected cause, then replay the same script and dataset. Keep the before-and-after output with the code change.
Watch p99 as well as p95. A p50 that barely moves while p99 climbs is the signature of a queue forming, and a queue forming is the early version of the stall you are trying to prevent. The full method, from modeling one real user journey to fixing the first bottleneck and rerunning, is on the page about load testing a web application.
Any load generator will do: k6, Apache Bench (ab), Locust, JMeter, Artillery, or autocannon. Pick the one you can install in five minutes. The tool matters far less than whether the script and the dataset are reproducible, because the only useful artifact is a result that says which resource saturated and whether one change moved that limit. Slowness carries its own price even when nothing errors: the BBC found it lost an additional 10% of users for every additional second its site took to load.
Common questions about AI app performance
What counts as a concurrent user?
A concurrent user is someone with a request in flight right now, not someone with an account or someone logged in today. If 100 people are using the app and each fires a request every 15 seconds that takes 250 ms, roughly 1.7 requests are in flight at any instant. That in-flight number, not the headcount, is what competes for connections, memory, and CPU.
Why does my app slow down with more users?
Some resource is taking longer to acquire or doing more work per request. Common causes include exhausted database connections, an N+1 query, a scan that grows with the table, an oversized response, CPU-heavy work, and a slow external service. Measure the request and its dependencies during the same load run to identify which one is responsible.
Is my app slow because of users or because of data?
Check whether the same page is slow with one user on it. A slow single request means concurrency is not required to reproduce the problem. A page that slows only under overlapping requests points you toward shared limits. Neither result names the cause. Compare dependency timing, query and connection counts, CPU and memory, queue wait, external-call duration, and response size before deciding what is constrained.
Why is my Lovable or Base44 app suddenly slow?
Start with three common database paths: a query that returns far more rows than the screen shows, a page that runs one query per row, or a table that grew past the point where an unindexed filter still felt free. Check those before you upgrade a plan. Then compare query and connection counts, dependency timing, CPU and memory, queue wait, external-call duration, and response size during the slow request. Those measurements show whether the constraint is in the database, app process, queue, response payload, or an external service.
The builder influences which limit you meet first. A Lovable app on Lovable Cloud runs on Supabase’s open-source foundation, so it inherits the Data API path and the connection behavior described above. Base44 runs its own managed backend, so the part still under your control is the data model you defined and how many records each entity query pulls back. In both cases, measure the request path before choosing a fix.
How many concurrent users can a Supabase project handle?
There is no plan-level user number, because Supabase publishes resource ceilings rather than user capacity. A Nano or Micro instance lists 60 database connections and 200 pooler clients, and Realtime is quoted separately at 200 concurrent connections on Free (both verified 5 August 2026). Your usable capacity depends on how many queries each request runs, how long each holds a connection, and whether you use transaction-mode pooling.
How many users can a vibe-coded app handle?
There is no reliable user-count answer. Capacity depends on concurrent requests, request mix, dataset size, cache behavior, external services, and the latency target. Test the busiest important endpoint with realistic data and report the result as a workload, such as 40 requests per second at a stated error rate and tail latency. What is a capacity plan covers how to write that result on one page, with its test conditions, so an investor or a customer can read it.
How do I handle 1000 concurrent users?
Convert the 1,000 into requests per second first, then size against that. A thousand people acting once every 20 seconds is 50 requests per second, and at a 200 ms response time that is 10 requests in flight. Ten requests in flight is the arithmetic result for that example, not a capacity verdict. Reproduce the named workload on the actual application and infrastructure, then measure queueing, connection use, CPU, memory, dependency time, latency, and errors before deciding what the server handles.
What is a good response time under load?
Set thresholds before the test from the user-facing service objective, expected request mix, infrastructure, and consequence of delay or failure. Record the target requests per second, tail latency, and error rate with those conditions, then pass, fail, and re-test against the same workload. Do not treat p95 below 800 ms, error rate below 0.5 percent, or a fixed p99-to-p95 multiple as a general baseline without evidence for this app.
Should I upgrade the database first?
Upgrade when measurements show the database is resource-bound after obvious query and connection problems are addressed. More compute can move a real CPU or memory limit. It can also postpone an N+1 query or an unbounded read while preserving the multiplying cost. When a memory limit shows up as Linux ending your process, how to read an OOM kill covers the log line, exit code 137 and what to change. Horizontal scaling vs vertical scaling covers which direction to scale first and what breaks when a second instance starts.
Do these fixes require a rewrite?
Connection configuration, relation loading, indexes, and pagination are usually local changes. A rewrite becomes plausible when the data model or synchronous request flow conflicts with the workload. Run the controlled test first so that decision has a measured cause. The order of changes by cost, before you add a server, is the subject of scaling web applications.
If you have a working app built with these tools and need it ready for real customers, this is what we do.
Built it with AI. Now it has to hold up for real customers.
The Production Hardening Sprint takes the app you already have and builds the production foundation underneath it. Authentication and access rules, payments that stay consistent, error handling, monitoring, backups, automated tests and a documented handover. Our engineers work inside your existing codebase for ten working days. All 123 deliverables are included, and you get the evidence for each one.
See the Production Hardening Sprint →  $2,500 fixed price · 10 working days · One codebase