Useful error logging records a structured event, preserves enough context to investigate the failure, removes secrets and unnecessary personal data before storage, and alerts the person who can act when the event meets an alert rule. A monitored error path is complete only after a deliberate safe failure reaches the destination and the intended notification channel.
Console output can be part of that setup. Many deployment platforms capture stdout and stderr. The questions that matter are whether the output is structured, retained, searchable, access-controlled, connected to a release and request, and capable of triggering a useful alert. If the app runs on AWS, AWS logging and monitoring for a small app covers the CloudWatch and CloudTrail settings to turn on and the alarms worth the bill.
In AxonBuild’s fixed June and July 2026 research cohort, 17 of 21 third-party apps recorded errors nowhere. This article owns the implementation problem: how to turn one failure into an event you can find, understand, and act on.
Separate logs, error tracking, traces, and uptime
These signals overlap, but each answers a different operational question.
| Signal | What it records | Answers | Blind spot |
|---|---|---|---|
| Application log | A structured event emitted by your code | What happened before, during, or after this action? | A process that died before it could emit anything |
| Error tracker | Exceptions grouped with stack, release, environment, and recurrence | Which code failures are new, repeated, or regressed? | Business failures returned as ordinary responses unless you capture them |
| Trace | One request or job across services and spans | Where did time or failure move through the system? | An external outage when no request reaches the app |
| Uptime monitor | An outside request to a URL or health condition | Is the service reachable and able to answer now? | A broken workflow that leaves the health endpoint green |
A small app may send structured logs and exceptions to one provider. Keep the concepts separate in the implementation so changing providers does not erase the distinction. Uptime monitoring for founders covers the outside-in signal; the rest of this article stays inside the application and its log pipeline. For the whole area, logging and monitoring for a small SaaS lists the eight controls that tell you when something breaks.
Give every event a stable shape
Free-form messages are hard to filter and easy to change. Define a small schema that every service and background job uses. OWASP’s Logging Cheat Sheet frames the required context as when, where, who, and what. How to do logging in a web app covers the event shape, the correlation id on every line, and what must never reach a log.
A production error event can look like this:
{
  "timestamp": "2026-08-02T10:14:32.184Z",
  "level": "error",
  "event": "checkout.fulfillment_failed",
  "message": "Paid order was not provisioned",
  "service": "web",
  "environment": "production",
  "release": "git:4f21c8a",
  "request_id": "req_01K1...",
  "trace_id": "7b1f...",
  "actor_id": "usr_8d2...",
  "object_id": "ord_91a...",
  "result": "failed",
  "reason_code": "database_timeout",
  "error_type": "TimeoutError"
}
The field names matter less than consistency. Use UTC timestamps, a stable event name, environment, release identifier, interaction or request ID, affected object, outcome, and a bounded reason code. Add an error type and stack trace for exceptions after reviewing exception messages and attached context for sensitive data. Keep the human message short enough to remain stable while the fields carry searchable detail. For a Python app, the Flask logger page sets up one JSON format for Flask and FastAPI. For a Node app, pino logging covers the setup, the levels, and when winston or morgan is the better fit.
OpenTelemetry’s logs specification defines trace and span IDs for correlating log records with a request across services. A single-service app can begin with request_id. Add trace context when background jobs, functions, queues, or external calls make one interaction difficult to follow. OpenTelemetry distributed tracing covers the smallest working setup per stack, what adoption costs, and the signs that a request id is still enough.
A log you can’t search is a log you’ll only ever scroll, and a log you only scroll gets read once, right after it stopped mattering.
Choose levels by required response
Levels should reflect what the operator needs to do, rather than how dramatic a message sounds. Logs severity levels in production covers the full scale from trace to fatal and which levels stay switched on.
| Level | Use it for | Example | Normal handling |
|---|---|---|---|
debug | Temporary diagnostic detail disabled or sampled in production | Cache key selection during a local investigation | Search during development; do not alert |
info | Expected state transitions worth retaining | User created, job completed, deployment started | Keep only when it answers an operational or audit question |
warn | A degraded path recovered or an assumption needs attention | Third-party request succeeded after retry | Review trends; alert only when rate or duration crosses a chosen boundary |
error | The requested action failed or required manual recovery | Payment succeeded but fulfillment failed | Create an actionable issue or alert based on workflow consequence |
fatal | The process cannot continue safely | Startup failed because required configuration is missing | Notify immediately; let the documented process supervisor or release policy stop or restart it |
HTTP status alone should not choose the level. A 404 from a bot may be routine. A 200 response that returns { success: false } after losing an order is an error even though the transport succeeded. The companion article on silent 200 OK failures covers the control-flow side of that problem. For the response the client receives, API error handling best practices covers one error shape, the status code for each failure, and one exception boundary per framework.
Capture every boundary where failures disappear
Install logging at the boundaries that own a side effect or can terminate independently:
- Request handlers: record unexpected exceptions, the request ID, route template, actor identifier when known, release, and final outcome.
- Background jobs and scheduled tasks: record job ID, attempt number, idempotency key when relevant, start, completion, retry, and terminal failure. For jobs on a timer, the cron every minutes guide covers where the scheduled job actually runs and how you know it ran.
- Browser application: capture unhandled errors and render failures with route, release, and a pseudonymous user identifier. Avoid recording form values and page content by default.
- External service calls: record provider, operation, duration, result, bounded error code, and retry outcome. Omit credentials and raw payloads.
- Business-critical state changes: record actor, target object, action, result, and reason for role changes, exports, deletions, refunds, and access revocation.
- Application startup and shutdown: record release, environment, configuration validation result, and whether required dependencies became ready.
An empty catch block will stay invisible. Capture the exception there and either return a deliberate failure, retry safely, or rethrow it to the boundary that owns the response. Avoid logging the same exception at every layer; one canonical event with a request or trace ID is easier to group than five near-identical copies. What a trace ID is covers how trace IDs and correlation IDs follow one request across your app.
Remove sensitive data before the event leaves the process
Logs often have broader access and longer retention than the application database. OWASP advises against recording passwords, access tokens, session identifiers, encryption keys, connection strings, payment-card data, and sensitive personal data directly. How to prevent insufficient logging and monitoring covers the OWASP A09 side: which security events to log and the checklist a reviewer asks for.
One fitness-plan app in the fixed audit cohort logged its full plan-generation request body, including age, weight, height, injuries, and dietary restrictions. That log created a second, potentially longer-retained copy of the app’s health data.
Use an allowlist of fields for each event. Replace a direct identity with an internal or pseudonymous identifier when email or name is unnecessary, and still treat that identifier as personal data where policy or law requires it. Strip query strings from URLs unless each parameter has been reviewed. Bound field lengths, remove carriage returns and line feeds from untrusted strings, and encode the final event as structured data to reduce log-injection risk.
Provider-side scrubbing is useful defense in depth. It cannot protect a secret already written to local stdout, a CI artifact, a transport buffer, or another destination before the provider receives it. Redaction belongs in the application’s log boundary.
Named tools: wiring an error tracker in one afternoon
For a solo founder, the practical destination is a hosted error tracker. Sentry, GlitchTip, and Rollbar all offer free tiers that cover pre-launch traffic, and GlitchTip is open source and self-hostable if the events must stay on your own infrastructure. Check each pricing page for current event quotas and retention before choosing; those numbers change too often to trust secondhand. Sentry vs Datadog compares what each tool costs and includes for free.
The install is short, and the call that matters is one block:
import * as Sentry from '@sentry/node';

Sentry.init({
  dsn: process.env.SENTRY_DSN,
  environment: process.env.NODE_ENV,
});
Wired before your handlers run, that call lets Sentry’s installed integrations capture the errors they cover. An exception caught and swallowed by your own code still needs an explicit capture call or a rethrow. Next.js wires the same idea across an instrumentation.ts file plus separate server, client, and edge configs rather than one central call. React needs an error boundary, or React 19’s built-in error handlers, so a render that throws gets reported instead of leaving a blank screen. The rule holds everywhere: give the SDK a DSN before you need it, not after your first outage.
Which builder produced the app changes where that DSN lives, not the code that reads it. If you built in Cursor, Claude Code or Windsurf, you already hold the repository, so the install and the init call are an ordinary commit. Lovable, Base44, Bolt, Replit and v0 generate and host the project for you, so the value goes wherever that platform keeps configuration, and those mechanisms are not interchangeable: Replit makes a stored secret available to the app as an environment variable, which is exactly what the block above reads, while Base44 hands secrets to backend functions through its own runtime module instead.
The DSN is not the part to guard: Sentry documents that a DSN is safe to keep public because it only allows events to be sent in, while Lovable’s security guidance covers the API keys that genuinely cannot sit in generated browser code. Where a hosted builder gives you no server file to edit at all, the browser SDK still reports render and request failures, and that is most of what a pre-launch app is losing today. If stack traces are minified and unreadable once those reports arrive, that page covers how to upload source maps to the error tracker without publishing them.
Define retention, access, and failure behavior
There is no universal retention period for a small app. Keep logs long enough to investigate the failures, security events, and contractual obligations that apply, then delete them on a documented schedule. If the app runs in Docker, how to clear Docker logs covers where container logs live and the settings that stop them filling the disk. Shorten retention or reduce fields when the debugging value does not justify the privacy and breach cost. How long to keep application logs sets a starting retention window for each kind of log and what keeping more costs.
Give production-log access to the smallest practical set of people and service accounts. Record administrative access where the platform supports it. Use encryption in transit, protect exported reports and backups, and confirm that deletion settings also cover archived copies where required.
The logging client itself can fail. A destination outage should not make checkout or login hang indefinitely. Use a bounded queue, timeout, and fallback appropriate to the runtime, including its shutdown or serverless execution limits. Decide what happens when the buffer fills, then test it. Dropping low-priority diagnostic events can be reasonable; silently blocking the main workflow is usually worse.
Alert on decisions, not every line
An alert should name the owner, the condition, the affected workflow, and the first investigation link. Useful starting conditions include:
- a new unhandled exception in production after a release;
- a sustained increase in failures for login, checkout, data export, or another primary workflow;
- a background job reaching its terminal retry;
- repeated authorization denials or input failures above the app’s normal baseline;
- the log destination rejecting events or receiving none from a service expected to emit them;
- an external health check failing while application logs are absent.
Choose thresholds from your own traffic and consequence. One failed payment fulfillment can require attention immediately, while one bot-generated 404 does not. Group repeated instances by error type, stack, route, release, and reason code so a burst creates one incident with a count rather than hundreds of notifications. Application monitoring best practices covers the signals worth watching first and how to prove each alert fires. What the owner does once an alert turns into an incident belongs in an incident response plan template with roles, a customer message, and a record. How to alert on error rate spikes gives starting thresholds for errors, latency, connections, queue backlog and spend, with a test for each. For alerts that land in a channel, Slack alerting covers where alerts go, who is on call, and how to tune out the noise.
Prove the pipeline with a failure drill
Test the complete path in a non-production environment first, then run a harmless production canary if policy permits. A test-only failure route must require authorization and must be removed or disabled outside the drill. Record the event ID and notification time so the test produces evidence.
| Failure to inject | Evidence to verify |
|---|---|
| Throw a controlled request-handler exception | One grouped error contains environment, release, route, request ID, stack, and no sensitive payload |
| Fail a background job through its final retry | Attempts share the job ID; only the terminal state triggers the chosen notification |
| Send an untrusted value containing a newline and an oversized string | The destination stores one bounded structured event without a forged second line |
| Disable the log destination or network path | The application follows the documented timeout and buffer behavior; a pipeline-health signal appears elsewhere |
| Repeat the same error many times | Grouping and rate controls prevent notification flooding while preserving the occurrence count |
| Stop the health dependency | The external uptime signal arrives even when application logging cannot run |
Rerun the affected rows whenever logging configuration, runtime, provider, routing, or alert policy changes. A load test is also a useful check: an app that stalls under concurrent users can lose or flood telemetry in ways a single test request never reveals.
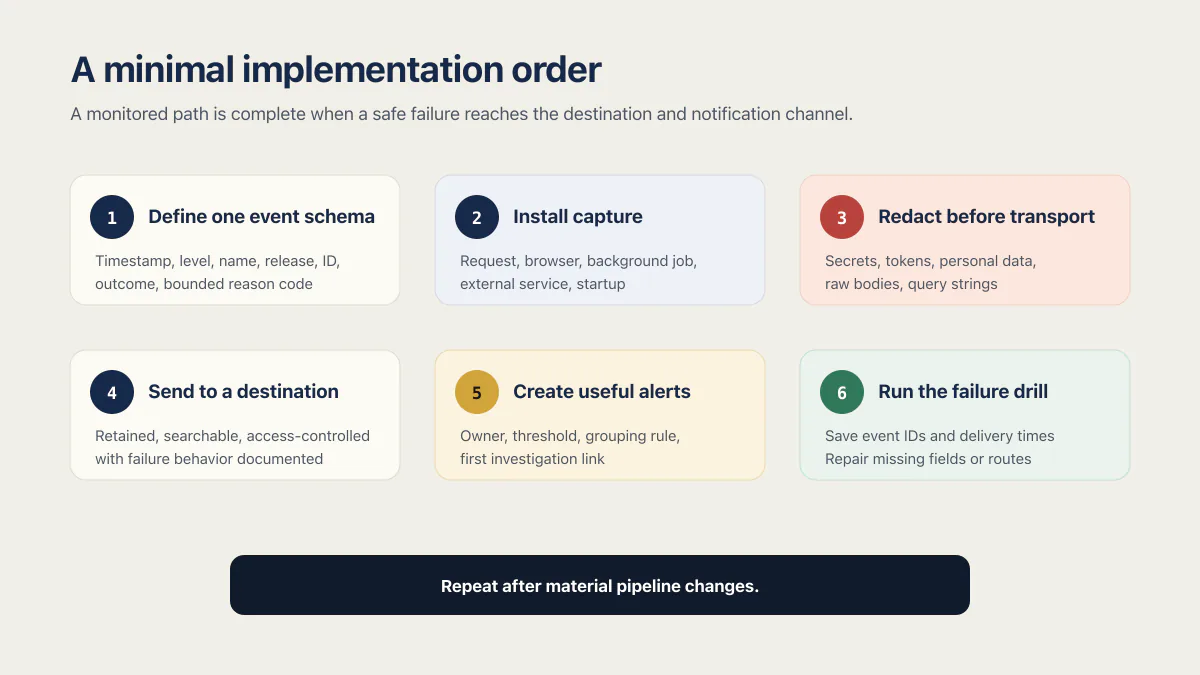
A minimal implementation order
- 01 Define one structured event schema with timestamp, level, event name, environment, release, request or job ID, outcome, and bounded reason code
- 02 Install capture at request, browser, background-job, external-service, and startup boundaries that can fail independently
- 03 Allowlist useful fields and redact secrets, tokens, personal data, raw bodies, and unreviewed query strings before transport
- 04 Send events to a retained, searchable, access-controlled destination and document buffer, timeout, and destination-failure behavior
- 05 Create a small set of consequence-based alerts with an owner, threshold, grouping rule, and first investigation link
- 06 Run the failure drill, save event IDs and delivery times, repair missing fields or routes, and repeat after material pipeline changes
The finished setup should let one customer report become a search for a request or event ID, followed by the exact release, failing boundary, and outcome. If the only available evidence is still a screenshot of an error message, the pipeline has another boundary to instrument. After an outage, RCA meaning in software covers the root cause analysis and the postmortem that makes the fix stick.
Common questions about error logging best practices
What information should every error log include?
Include when the event happened, the service and environment, release, stable event name, request or job ID, outcome, bounded reason code, and the affected object or pseudonymous actor only when needed. Exceptions can also include an error type and sanitized stack trace. The exact fields should serve a defined investigation or alert decision.
Is console.log enough for a production app?
Console output can be enough as the application emission method when the deployment platform captures it reliably. It still needs structured fields, retention, search, access control, release and request correlation, destination-health monitoring, and consequence-based alerts. A terminal line nobody retains or watches is not an operational logging pipeline.
What should never be written directly to logs?
Do not write passwords, private API keys, access or session tokens, connection strings, encryption keys, payment-card data, raw request bodies, or sensitive personal data directly. Allowlist fields and redact them before the event leaves the process; provider-side scrubbing is a second control, not the first one.
How are error logging and error tracking different?
Logging records structured events from the application. Error tracking usually groups exceptions and adds recurrence, release, stack, and regression context. One provider may store both, but a business failure returned as a normal response will not become an exception unless the application records it deliberately.
If you have a working app built with these tools and need it ready for real customers, this is what we do.
Built it with AI. Now it has to hold up for real customers.
The Production Hardening Sprint takes the app you already have and builds the production foundation underneath it. Authentication and access rules, payments that stay consistent, error handling, monitoring, backups, automated tests and a documented handover. Our engineers work inside your existing codebase for ten working days. All 123 deliverables are included, and you get the evidence for each one.
See the Production Hardening Sprint →  $2,500 fixed price · 10 working days · One codebase