If a user, client, payment, or business workflow depends on your live app, add outside-in uptime monitoring now. Traffic volume is a poor threshold. The useful threshold is consequence: would an outage matter, and would anyone on your side learn about it before a user reported it?
An uptime monitor checks the app from outside your infrastructure on a schedule and sends an alert when the expected response fails. It shortens the gap between an outage starting and someone who can act finding out.
What uptime monitoring can tell you
A basic monitor can establish that a URL answered within a timeout and returned the expected status or content. It cannot establish that every feature works, that data is correct, or that a customer can finish a critical workflow.
| Monitoring layer | What it detects | What it can miss |
|---|---|---|
| Public URL check | DNS, TLS, routing, and an HTTP response | A cached page while the database is down |
| Readiness endpoint | Whether the app and selected dependencies can answer | A broken user-specific or payment workflow |
| Synthetic transaction | Whether a controlled critical flow completes | Failures outside the scripted path |
| Error tracking | Exceptions and handled failures inside running code | A process or host that never runs the logger |
Most founder-run apps should start with a public check and a shallow readiness endpoint. Add a synthetic transaction when one workflow has enough consequence to justify the maintenance, such as sign-in or a non-destructive test checkout. The signals worth watching beyond uptime, and the smallest setup that covers them, are in application monitoring best practices.
Why a small live app still needs an outside check
AxonBuild’s fixed June and July 2026 study found that 17 of 21 third-party apps had no error tracking or alerting. Deployment and Operations averaged 37.0 out of 100 across the same historical cohort. Those figures describe a selected set of apps and do not estimate all AI-built products. They show how often feedback mechanisms were absent even when the visible product worked.
One audited repo-health dashboard had a public scan endpoint that could make more than 100 outbound calls from a single request using one shared provider token. Repeating that request could exhaust the shared allowance and make the tool unavailable to everyone. An external monitor would detect the resulting availability symptom. It would not explain the unthrottled fan-out that caused it, which still requires logs and code-level diagnosis.
This distinction is useful. Uptime monitoring discovers a class of failure quickly. It does not remove the need to investigate the cause. The wider set of logging and monitoring controls a small SaaS needs, and the symptom each one prevents, has its own page.
Put a number on the consequence before deciding how much detection speed is worth. An app taking $500 a day loses roughly $21 for every hour it is down, before the support replies and the trust that never shows up on an invoice. The number itself matters less than having one. A founder who cannot state it has not decided how fast an outage needs to be caught.
Monitoring an app you built with Lovable, Base44, Bolt, Replit, or Claude Code
Apps built with AI tools fail in ways that generic monitoring advice misses.
Monitor the custom domain your users actually visit, not the tool’s preview or staging URL. Preview URLs often stay up (and stay cached) after the production deploy breaks, so a monitor pointed at the preview is a monitor that will never alarm.
Expect false alarms on free hosting tiers where the instance sleeps and the first request has to cold-start. A cold start can exceed a strict monitor timeout, which reads as an outage that was not one. Give the check a timeout that tolerates a cold start, or move to a plan that stays warm before tightening the threshold.
Do not repurpose the monitor as a keep-alive pinger to dodge that. It turns your monitor into a load generator, and it hides the exact behavior your first real user of the day is going to get. If cold starts are unacceptable, the fix is a paid always-on instance, not a ping every five minutes.
Watch the database separately, because it fails in ways the homepage cannot show. Supabase pauses free projects that show low activity over a 7-day period, which is exactly the state a low-traffic launched app drifts into. A statically served homepage keeps returning 200 while every logged-in feature fails. A readiness endpoint that touches the database is what catches this, and a keyword check is what stops the cached homepage from covering it up. Both are set up further down.
One more thing: your platform’s status page is not your monitor. It reports the platform’s view of the platform, not whether your specific app, domain, certificate, and database are serving your users right now.
Uptime monitoring and error tracking do different jobs
An error tracker such as Sentry runs inside your application and records failures while enough of the process is alive to report them. An external uptime check can still fail when the process never starts, DNS breaks, TLS expires, a deploy routes nowhere, or the database prevents the app from becoming ready.
Set up the external check first when neither exists because it requires little application code and covers complete unavailability. Then add error tracking for failures that leave the app running. A silent failure that still returns 200 OK explains why a successful status code alone cannot prove the operation succeeded. Picking the error tracking tool itself, and what each option costs, is covered in Sentry vs Datadog. Putting uptime, errors, latency, signups and revenue in a single view is covered in how to build an ops dashboard. If stack traces are minified and unreadable in the error tracker, that page covers uploading private source maps and testing one error end to end.
What you log, and how loudly you log it, is a separate decision worth getting right. Uptime alerts should tell you that a path failed; application logs should give you enough context to trace why, without placing secrets or personal data in the alert.
The smallest useful setup
A free tier covers most founder-run apps. Pick a provider that supports HTTPS checks, a suitable interval, at least one alert channel you actually watch, test alerts, and a status history long enough to investigate an incident. These four fit that description; UptimeRobot needs no credit card to start, which makes it a common first pick.
| Provider | Free tier | Check interval | Pick this if |
|---|---|---|---|
| UptimeRobot | 50 monitors, email alerts (SMS and voice credits cost extra), no credit card | 5 minutes | You want the most monitors for free with the least friction |
| Sentry | 1 uptime monitor and 1 cron monitor bundled with the free error-tracking plan | Configurable, 1 minute to 1 hour | You already want error tracking and want outages linked to traces |
| Cronitor (Hacker plan) | 5 monitors, email and Slack alerts | 5 minutes | You also have scheduled jobs that need watching |
| Pulsetic | 10 monitors, 3 regions, 3 status pages, 3 months of history | 5 minutes | You want multi-region checks and a status page on the free tier |
Free-tier limits checked 5 August 2026. Limits and notification channels change, so verify them at signup rather than trusting a table, this one included.
Configure the first check this way:
- 01 Monitor the canonical production URL from outside the hosting account
- 02 Set an explicit timeout and require the expected status or a small stable response body
- 03 Send alerts to a channel checked by a named person, with a second channel for a business-critical app
- 04 Trigger a test alert and confirm it reaches the right person before relying on the monitor
- 05 Record the monitor owner, renewal or billing owner, and where recent incidents can be reviewed
An alert that nobody has tested is another unverified dependency. Triggering one during setup also catches spam filtering, an old email address, or a channel nobody watches outside working hours.
How fast will you actually find out?
Detection is not instant, and the delay is arithmetic you can do in advance. An outage can start one second after a check passed, so the worst case is roughly the check interval multiplied by the number of failing checks the provider needs before it alerts.
| Check interval | Failing checks before an alert | Worst case before anyone is paged |
|---|---|---|
| 5 minutes | 1 (alert on the first failure) | About 5 minutes |
| 5 minutes | 2 (one confirming check) | About 10 minutes |
| 5 minutes | 4 (three confirming checks) | About 20 minutes |
| 1 minute | 4 (three confirming checks) | About 4 minutes |
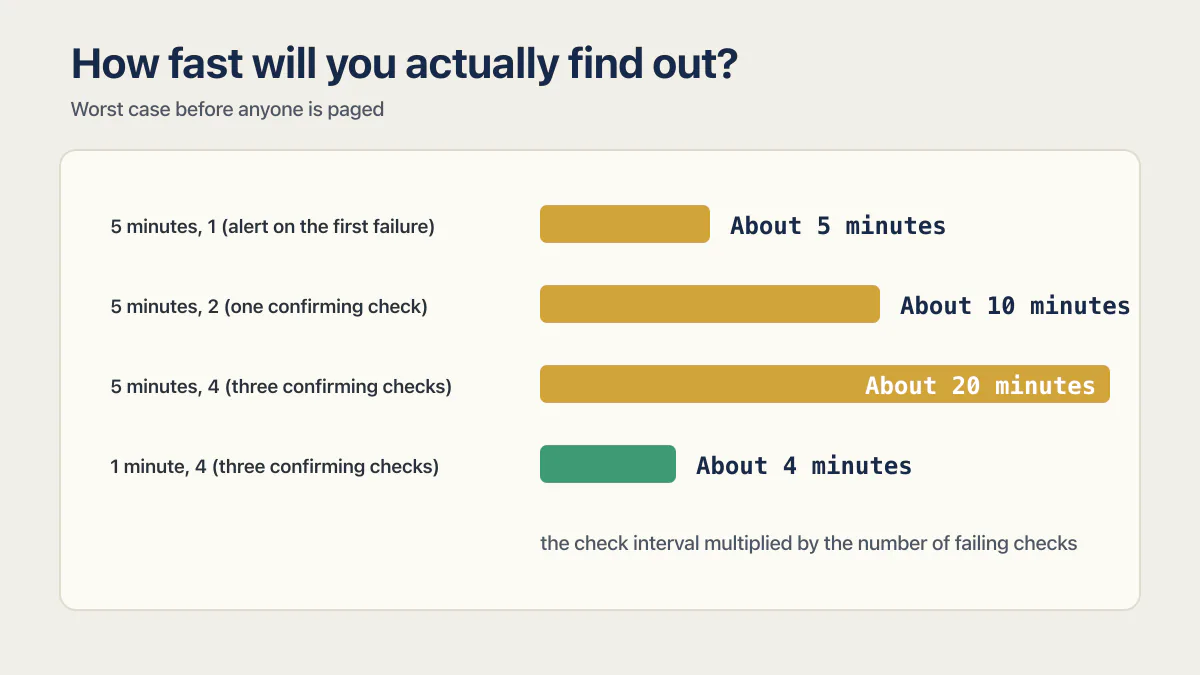
Shorter intervals catch outages faster and produce more false alarms, so pair a short interval with a consecutive-failure threshold instead of choosing between the two. Sentry’s uptime checks run on intervals from 1 minute to 1 hour and open an issue after three consecutive failures by default, which is a reasonable shape to copy on any provider that lets you set it.
Then add the human gap. A 5-minute free interval plus confirmation means real downtime can run 10 to 15 minutes before the alert is sent, plus however long it takes the alert to reach someone awake. If that total is unacceptable for your app, the fix is a shorter interval and a channel that interrupts, not a better dashboard.
What 99.9% uptime actually means
Uptime percentages sound strict and are looser than founders expect. Over a 30-day month:
| Uptime target | Downtime allowed per 30-day month |
|---|---|
| 99% | About 7 hours 12 minutes |
| 99.5% | About 3 hours 36 minutes |
| 99.9% | About 43 minutes |
| 99.99% | About 4 minutes 20 seconds |
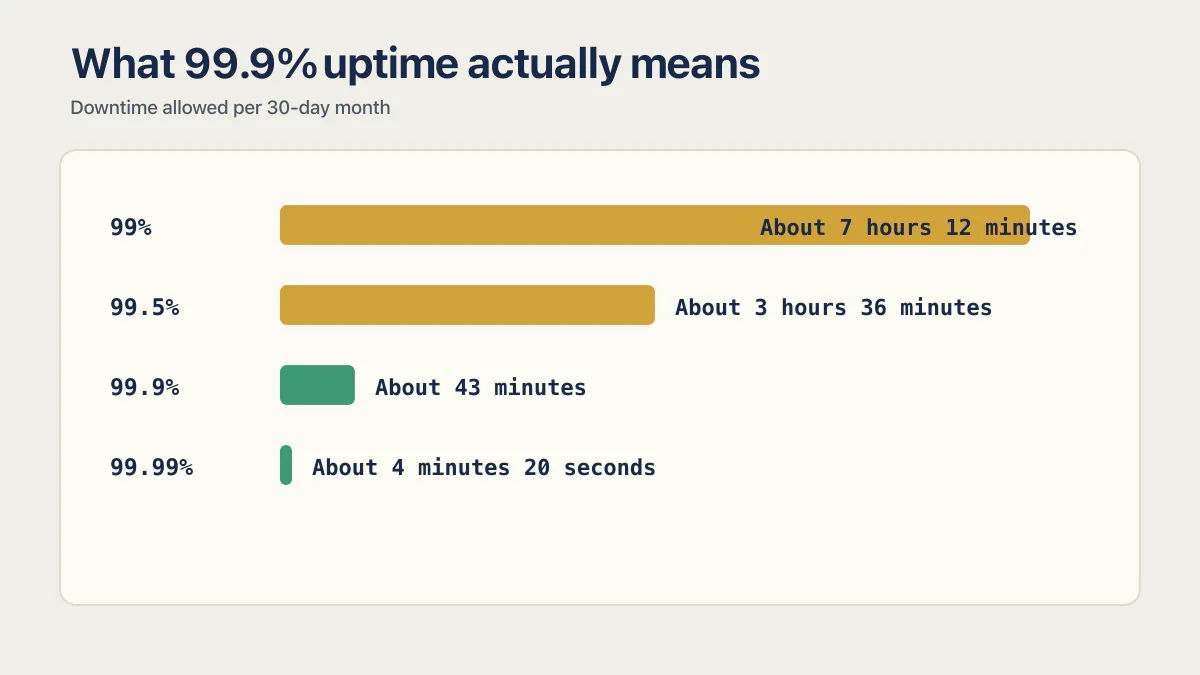
Three nines (99.9%) is the number most client contracts ask for and the number most founder-run apps cannot prove. An SLA is the availability you promise a customer, usually with money attached. An SLO is the internal target you hold yourself to. MTTR is how long recovery takes once you know something is wrong. Do not write an uptime number into a contract before a monitor has been measuring that number for a few months, because the contract creates the obligation and the monitor is the only thing that produces the evidence. The recovery side of that promise, with the RTO and RPO to name and a timed restore drill, is set out in the disaster recovery checklist for SaaS.
Point the monitor at a route that can fail meaningfully
A cached homepage can keep returning 200 OK while database-backed features fail. The fix is a route that actually touches the thing you depend on, not a page that returns 200 no matter what.
Use separate concepts when the app needs them:
| Check | Contract |
|---|---|
| Liveness | The process is running and can answer |
| Readiness | The process can serve traffic and reach a small set of critical dependencies |
| Synthetic check | A controlled user journey works from the outside |
A readiness endpoint might run a cheap database query with a short timeout. Keep it unauthenticated only if its response reveals no version, secret, hostname, stack trace, customer data, or internal topology. Return a small status and the appropriate non-200 response when a critical dependency is unavailable. 503 Service Unavailable is the conventional answer for a server that is temporarily not ready, and it is a response nobody should cache, so send Cache-Control: no-store with it. Without that header a proxy can replay an earlier healthy answer while the app is down, which is the same failure the monitor exists to catch.
curl --fail --max-time 5 https://yourapp.com/api/health/readyThis site’s own readiness route is the shape being described. It opens the configured SQLite database, runs one bounded query, and answers 503 with caching disabled when that throws:
export const GET = () => {
  try {
    getDb().run(sql`select 1`);
    return new Response(JSON.stringify({ status: 'ok' }), {
      status: 200,
      headers: { 'Content-Type': 'application/json', 'Cache-Control': 'no-store' },
    });
  } catch (error) {
    console.error('[health] database readiness check failed', error);
    return new Response(JSON.stringify({ status: 'unavailable' }), {
      status: 503,
      headers: { 'Content-Type': 'application/json', 'Cache-Control': 'no-store' },
    });
  }
};
Two things about that route are specific to this site rather than universal. The first call also applies committed database migrations through the app’s normal startup path, which makes it a release gate as much as a recurring check, so an app that runs migrations as a separate release step should keep the route read-only. And it earns its place because something calls it: the production deploy script polls it with a two-second request limit after a release and rolls back to the previous release when it does not answer. A route nobody calls changes nothing, so decide who calls yours, how often, what counts as a failure, and what happens next. When the app runs in containers, the platform can be one of those callers: a Docker Compose health check covers the example file, the restart policies, and why an unhealthy container is left running.
Use a keyword check so a cached page cannot pass
A 200 response proves something answered, not that it answered correctly. Have the readiness endpoint return a short fixed string such as ready, then configure the monitor to require that string in the body rather than accepting any 200. Providers call this keyword monitoring or content matching. UptimeRobot and Pulsetic both include it on their free plans (checked 17 August 2026). Sentry’s equivalent is asserting on the response itself instead of on availability alone. This one setting is what stops a cached page, a maintenance placeholder, or a friendly error page from keeping the monitor green.
The same trap sits one layer further back, in the route itself. This is the handler most apps ship first:
app.get('/health', (_req, res) => {
  res.status(200).json({ status: 'ok' });
});
It proves that the web process accepted a request, and nothing else. That is a fair liveness signal if process reachability is the whole promise. It is not a database-aware readiness check, so if the app cannot do anything useful without its database, this route stays green while every real request fails, and a keyword check on ok will happily agree with it. Hardcoding the answer is how a control ends up existing in the file tree and doing nothing in production.
A health check that always answers ok is the 200 that lies, one layer upstream. It just tells the lie to your monitor instead of your customer.
The opposite mistake is putting every external dependency into one check. A slow analytics API, email provider, payment processor, or model call should not necessarily take the whole app out of service, and each one makes the endpoint slower and easier to rate-limit. Include a dependency only when the app should stop taking traffic without it, and give every network call in there a short timeout. What a health check endpoint is covers the degraded status for optional providers and what the response must never expose.
Avoid turning the health check into load of its own. It should not write customer data, enqueue real jobs, send email, call an expensive model, or scan every dependency on every interval. A deeper synthetic test can run less often with a dedicated test account and cleanup rules.
Monitors worth adding after the first one
A URL check is the first monitor, not the only one. These four catch outages that a homepage check never sees, and all four are standard monitor types on the providers above.
SSL certificate expiry
An expired certificate takes the app fully dark, in the browser, with a warning page that looks like a hack. Let’s Encrypt certificates are valid for 90 days and Let’s Encrypt recommends renewing every 60, which almost always happens automatically until a renewal job breaks quietly. A certificate-expiry monitor warns you weeks ahead instead of at the moment of failure.
Domain expiry and DNS changes
A lapsed domain renewal and an edited DNS record both take the app down without touching the code. Domain-expiry monitoring watches the registration date, and DNS-change monitoring alerts when a record moves, which is also how you find out somebody changed a nameserver without telling you.
Heartbeat checks for jobs that stop silently
A scheduled job that stops running produces no error page and no failed request, so no uptime check will ever notice. A heartbeat monitor, sometimes called a dead man’s switch, inverts the logic: the job pings a URL when it finishes, and the monitor alerts when that ping does not arrive on time. This is what Cronitor is built around, and Sentry’s free plan includes one cron monitor. Backups, nightly imports, invoice runs, and cleanup jobs all belong here. Running cron every few minutes covers the schedule line itself, where the job runs on each common host, and how to prove each run happened.
Response-time thresholds
An app that answers in nine seconds is technically up and practically broken. Set an alert on response time as well as availability so a slow degradation is visible before it becomes an outage. A threshold somewhere between your normal response time and the point where users abandon is fine; the exact number matters less than noticing a change in it. If you collect your own metrics, Prometheus metric types covers what to count, what to time, and the queries that read them.
What to monitor at your stage
The right setup depends on what an outage would cost, so pick the row you are actually in and stop there.
Pre-launch or demo only
A public URL check with an email alert. That is the whole setup. You are covered for the case that matters at this stage, which is a broken deploy or an expired certificate leaving your demo link dead when someone finally clicks it.
First paying users
Add a readiness endpoint with a keyword check, which UptimeRobot’s free plan supports, and add one alert channel that interrupts you (push notification or SMS), because email alone does not reach you in the evening. Write down who looks when it fires. When the person who tells you is a paying customer rather than the monitor, the first hour runs in a different order.
Payments or client work
Add a synthetic check on the one workflow that produces money (sign-in or a non-destructive test checkout), a second alert channel, and a named backup person who can act when you are unreachable. Add certificate and domain expiry monitoring here too, since these are the failures that hit at the worst possible time.
A contract with an uptime number in it
Add multi-region confirmation, retained incident history you can show a client, and a public status page. At this point the monitor is producing evidence for a commercial obligation, so the record it keeps matters as much as the alert it sends. If you are weighing a hire for this work, what a site reliability engineer is covers what the role owns and what a five-person SaaS does instead.
Decide what should wake someone up
Alert severity should follow impact. A single failed probe can be a network hiccup; five minutes of failed readiness checks may be a real outage. Configure confirmation and recovery notifications so the person receiving the alert knows whether the condition persisted and when it cleared.
Require a second location to agree before paging anyone. A check that fails from one region and passes from another is usually a routing or network problem between the monitor and your app, not your app being down. Multi-region confirmation and a consecutive-failure threshold are the two settings that decide whether you trust your own alerts, and an alert nobody trusts gets ignored on the day it is real.
Then pick a channel that actually interrupts. Email and a Slack channel with notifications muted do not wake anyone at 2am, so at least one channel should be SMS, a phone call, or a mobile push notification. This is the real limit of the free tiers above: UptimeRobot’s free plan sends email, and SMS and voice-call credits have to be bought separately. A free push app on your phone is usually the cheapest fix.
For a founder-run app, write down three facts beside the monitor:
- Who receives the first alert?
- How long can the app stay unavailable before another person must know?
- What is the first safe diagnostic step?
The first five minutes of an alert
Decide the sequence before you need it, so a 2am alert becomes a checklist instead of a panic:
- Confirm from a second source, such as your phone on mobile data rather than your home network.
- Check the hosting provider’s status page.
- Check whether a deploy just shipped, and what was in it.
- Check the database or its provider dashboard, including whether the project is paused or over a limit.
- Decide roll back or wait, and say which one you chose and when.
Keep every step read-only. An automated restart can erase evidence or create a restart loop when the actual problem is a dependency or migration. If there is no monitor at all and the app is down right now, the timed sequence for the first hour starts before any of this.
Do you need a public status page?
Usually not at first. A status page earns its keep when the app is client-facing, when an outage fills your inbox with the same question, or when a contract asks you to show incident history. It costs you when nobody updates it during a real incident, because a status page reading “all systems operational” while the app is down reads worse than no status page at all. If you publish one, the rule is simple: whoever gets the alert also posts the first update, even when the update is just “we are looking at it”.
Self-hosted or hosted?
Self-hosted monitors are the standard answer whenever founders ask this question in public, and they are a real option. Uptime Kuma (MIT licensed) and Gatus (Apache 2.0) are both free, open source, and run on a small server you control, with unlimited monitors, no plan limits, and your own status page.
One caveat decides it. A monitor running on the same server as your app, or in the same account at the same hosting provider, is not an outside-in check. When the host has a bad day, the app and the thing meant to tell you about the app go down together, silently. If you self-host a monitor, host it somewhere else: a different provider, a different region, ideally a cheap box that does nothing else.
The honest tradeoff is that a self-hosted monitor is one more thing you now own, patch, and back up, and it can fail quietly like anything else. For a solo founder, a hosted free tier is less work and less to forget. Self-hosting starts paying off when you have many monitors, want data that stays on your infrastructure, or already run a server for something else.
Test the monitor, then keep it current
Verify detection without taking production down. A staging environment can return a controlled failure, or a temporary test endpoint can switch from 200 to 503. Confirm that the provider detects the failure, sends the alert, recognizes recovery, and records the event.
Review the setup after changes to domains, hosting, auth, databases, alert channels, and team ownership. A monitor pointed at an old URL can stay green forever while the current app has no coverage.
The success metric is simple: when a real outage starts, a named person receives a useful alert before a customer has to explain the problem. Detection still does not tell users what is happening; the small-SaaS status-page guide covers the separate communication decision and incident-update record.
Common questions about uptime monitoring for founders
Do I need uptime monitoring for a small app?
Yes when a user, client, payment, or important workflow depends on it. Consequence is the threshold. A low-traffic app can remain unavailable longer before organic traffic reveals the outage.
Which should I set up first, uptime monitoring or error tracking?
Start with an external uptime check when neither exists, then add error tracking. The external check covers complete unavailability; error tracking covers many failures inside a running process.
What is the cheapest real setup?
Free, for most founder-run apps. Checked on 5 August 2026, UptimeRobot’s free plan covered 50 monitors on a 5-minute interval with email alerts and no credit card required, and Cronitor, Pulsetic, and Sentry offered smaller free tiers that also cover a single app. Verify limits and alert channels at signup, since free plans change.
What should the monitor check?
Start with the production URL and a shallow readiness endpoint that checks only critical dependencies with short timeouts. Add a synthetic critical-flow test when the workflow’s consequence justifies its upkeep.
Is a homepage check enough?
It is useful for DNS, TLS, routing, and basic HTTP availability. Add a readiness endpoint when a cached or static homepage can stay healthy while the database or another essential dependency is unavailable.
How often should an uptime monitor check my site?
Every 5 minutes is enough for most founder-run apps and is what the free tiers offer. Shorter intervals of 1 to 3 minutes are worth paying for when an outage costs money by the minute. Remember that the worst case is roughly the interval multiplied by the number of failing checks needed before an alert, so a 5-minute interval with one confirming check means about 10 minutes before anyone is paged.
What does 99.9% uptime mean in minutes?
99.9% uptime allows about 43 minutes of downtime in a 30-day month. For comparison, 99% allows about 7 hours 12 minutes, 99.5% about 3 hours 36 minutes, and 99.99% about 4 minutes 20 seconds. Do not promise a number in a client contract until a monitor has been measuring it for a few months.
Do I need a status page?
Not at first. A status page is worth it when your app is client-facing, when outages fill your inbox with the same question, or when a contract asks for incident history. A status page nobody updates during an incident is worse than not having one.
Is a self-hosted monitor like Uptime Kuma good enough?
Yes, as long as you host it somewhere other than your app. Uptime Kuma and Gatus are free and open source, give you unlimited monitors, and include status pages. A monitor running on the same server or the same hosting account as the app is not an outside-in check, because both go down together.
If you have a working app built with these tools and need it ready for real customers, this is what we do.
Built it with AI. Now it has to hold up for real customers.
The Production Hardening Sprint takes the app you already have and builds the production foundation underneath it. Authentication and access rules, payments that stay consistent, error handling, monitoring, backups, automated tests and a documented handover. Our engineers work inside your existing codebase for ten working days. All 123 deliverables are included, and you get the evidence for each one.
See the Production Hardening Sprint →  $2,500 fixed price · 10 working days · One codebase