Your app answered quickly while you were building it, and now a customer is watching a spinner. Load may have changed, but so might the row count, deployment region, connection path, cache state, or upstream service. API response time is the elapsed time from a client’s request until it receives the response. Network travel, queueing, application work, database queries, and downloads can all contribute.
There is no universal “good API response time.” Set a separate target for each important endpoint, collect repeated real-request timings, and keep slow requests and failures in view. A login, search, report export, and streamed AI response should not share one arbitrary millisecond budget.
What is a good API response time for a solo-built app?
Human perception sets the experience budget, while the workflow and its dependencies set the API target. Jakob Nielsen’s research at Nielsen Norman Group names three interaction thresholds that help explain how software feels:
| Response time | What the user feels |
|---|---|
| Up to 0.1 second | Feels instantaneous; no loading state needed |
| Up to 1 second | The user’s train of thought stays unbroken, though the delay is noticeable |
| Up to 10 seconds | The outer limit for holding attention on the task at all; past this, people mentally check out |
Google’s RAIL performance model uses 100 milliseconds for visible acknowledgement of an input, not for completion of every API request. A button can acknowledge a click while a longer server task continues with progress or streamed output. For the browser-side loading, interaction, and layout signals, the Core Web Vitals guide for AI-built apps separates public-page field data from logged-in diagnostics.
Checked August 2026, the numbers people quote as API benchmarks are interaction thresholds rather than API ones. The perception limits above come from interface research, and the browser-side interaction threshold Google publishes is a separate measurement with rules of its own. Both bound what a person waits through, so treat them as a ceiling on the whole interaction, not as a per-endpoint number to copy.
Define the API objective as a route, supported input, threshold, and measurement window. For example: “Authenticated search completes in under 800 ms for supported queries; slower and failed requests are logged and reviewed over seven days.” The value is a product choice, not an industry constant. Keep the complete distribution rather than reporting one average that hides the slow requests real users encounter. Tail latencies explains what p95 and p99 mean and how to calculate them from your logs.
A useful API target starts with the action the person is waiting to finish, not one universal millisecond number.
Why your API was fast in the demo and slow now
A local measurement describes one environment and one input. It may use a warm process, a nearby database, a tiny table, cached data, and one request at a time. Production adds real row counts, network hops, variable input sizes, cold starts, and concurrent work. A code regression is also possible. Compare the same route, input class, and dataset before deciding which condition changed. API load testing covers the workload to send, the numbers to record by route, and which bottleneck to fix first.
How to reduce API response time: where an AI-built app loses its milliseconds
In AxonBuild’s fixed June and July 2026 corpus, overall scores across 26 apps ranged from 29 to 81 with a mean of 52.1, and none reached the green band. The Performance & Scale pillar averaged 53.3 across the 21 third-party apps for which that pillar was scored. Five founder-built apps are part of the overall 26 but not that pillar denominator; the full pillar-by-pillar ledger has its own writeup elsewhere. The recurring performance findings were ordinary query, connection, and request-path decisions that small demo datasets did not expose.
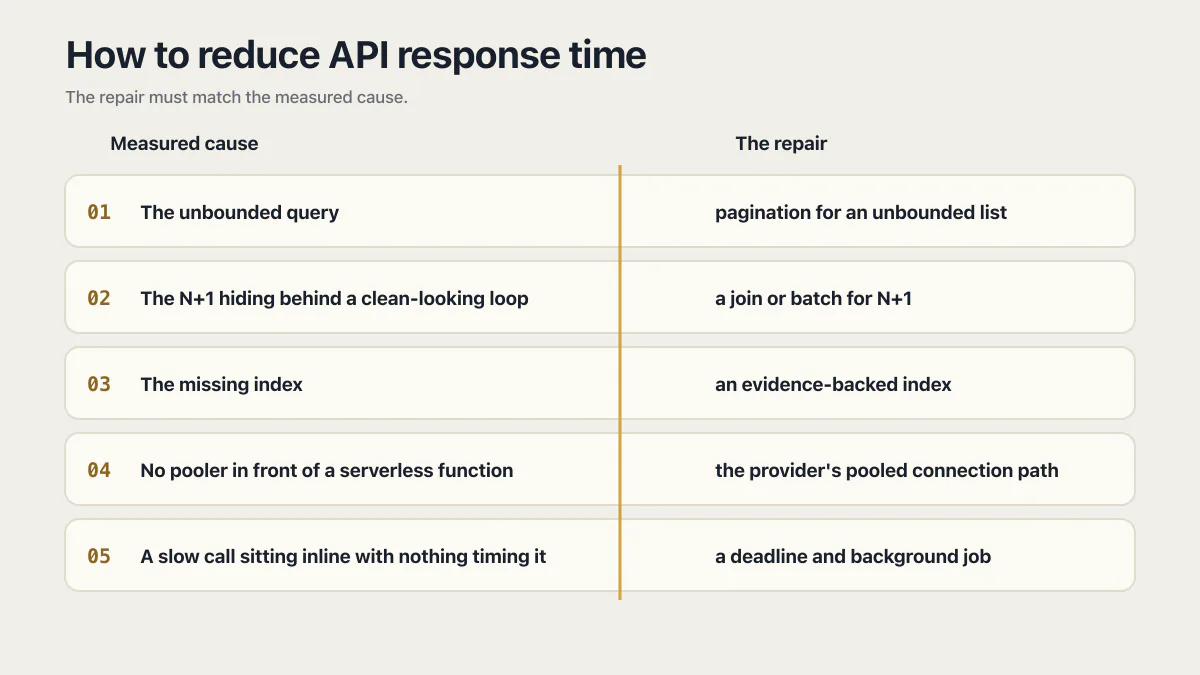
1. The unbounded query
A list query using SELECT * with no selective filter, pagination, or limit can fetch every matching row and every column. It may answer a ten-row demo quickly, then grow in work and payload as the account accumulates history. The same uncapped query that slows the response also runs up the egress bill behind it, one query shape showing up as two separate line items on two separate dashboards.
2. The N+1 hiding behind a clean-looking loop
One query loads a list, then one more fires for every item. Ten rows cost eleven round trips; a thousand rows cost a thousand and one. The pattern may hide behind an ORM relation helper or .map(async …), but query logs and a careful review can reveal it. A dedicated post walks through spotting it with Postgres’s own query stats and replacing it with a join or a batched fetch.
3. The missing index
PostgreSQL automatically creates the index that enforces a primary key or unique constraint, as its unique-index documentation explains. It does not automatically choose every workload-specific index for filtered, sorted, or joined columns. A missing useful index can produce a sequential scan at volume, but the remedy should follow EXPLAIN evidence rather than adding indexes to every column. How to analyze a Postgres query plan walks through reading EXPLAIN ANALYZE and adding the indexes that actually help.
4. No pooler in front of a serverless function
Many serverless database providers expose a pooled or serverless connection path because short-lived, horizontally scaled functions can create more connections than the database can accept. Under concurrency, requests may queue for a connection and then time out. That is the connection version of why an AI-built app stalls once a hundred people show up at once. Which of the three layers actually produced the error string in your logs isn’t something to guess at here. Lambda concurrency gets its own page: how it is calculated, and why the database is often the first limit a serverless app hits.
5. A slow call sitting inline with nothing timing it
The fifth source has nothing to do with a query. A third-party API or a model call sits inline in the request path with no timeout and nothing decoupling it from the response, so the handler’s response time becomes whichever external service is slowest that second. One of my own five apps, a multi-tenant WhatsApp AI-agent platform, shows the pattern plainly: it had a full retry-and-dead-letter queue built, and the live message path never actually used it, calling the model synchronously on every inbound message instead. Every reply’s response time was the model’s response time, plus whatever queued behind it, because the piece that would have decoupled the two sat there switched off. Left long enough with no clock on it, the same call turns a slow response into an outright timeout. How to set a timeout on fetch covers that deadline, and the same one on the AI, payment and email SDKs.
The repair must match the measured cause: pagination for an unbounded list, a join or batch for N+1, an evidence-backed index, the provider’s pooled connection path, parallel execution for independent calls, or a deadline and background job for slow dependencies. Some are small patches; moving work off the request path can be an architectural change. Load is one of the seven launch-readiness questions, and a repeatable script can supply evidence for it. For the controls beyond a single route, web performance optimization for an AI-built app lists seven, from caching to a load test, with the test for each one.
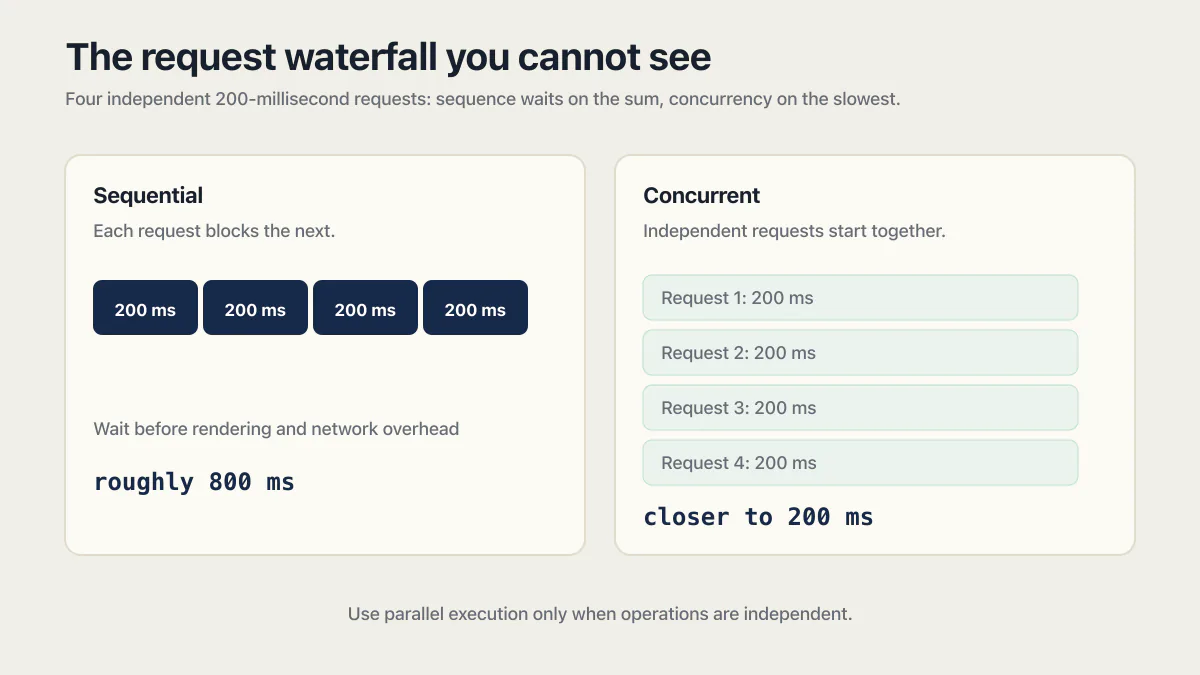
The request waterfall you can’t see
Independent calls executed in sequence add another common delay. Three sequential awaits stack three wait times even when no result depends on the one before it.
// Sequential: each await blocks the next, even though none of them depend on each other.
const user = await getUser(userId);
const orders = await getOrders(userId);
const invoices = await getInvoices(userId);

// Parallel: all three fire at once; the response waits on the slowest one, not the sum of all three.
const [user, orders, invoices] = await Promise.all([
  getUser(userId),
  getOrders(userId),
  getInvoices(userId),
]);
The frontend can create the same waterfall. Four independent 200-millisecond requests fired one after another contribute roughly 800 milliseconds before browser rendering and network overhead, while concurrent requests wait closer to the slowest of the four. Use parallel execution only when the operations are independent and the backend can handle the concurrency.
What to measure without an APM
Start with browser timing and server logs, then collect enough samples to see the distribution.
- Open the browser’s DevTools Network tab, reproduce the slow action, and identify the route, status, payload size, and request waterfall. One run is a trace, not a performance baseline.
- Break the route into spans around authentication, database work, external calls, serialization, and response streaming. Include a request ID so the browser event and server logs can be joined.
- Optionally expose safe aggregate durations through the
Server-Timingheader. Do not reveal table names, infrastructure details, or sensitive identifiers on public responses. - Re-run the same request against a table seeded with realistic row counts, not the dozen demo rows it was built against; several of these failure modes only exist past a threshold your test data never reached.
- Group comparable requests by route and result type, then compare the typical cases with the slowest completed requests. Keep failures and timeouts in the dataset instead of measuring only successful responses.
If a single query turns out to be the one eating the budget, the triage for that starts with your database’s own status page, then the query shape underneath it, a longer walkthrough than fits in a summary here.
When it’s actually the platform
Platform configuration can be part of the path: a Function far from its database, cold-start behavior, memory or CPU limits, or a concurrency ceiling. Compare application spans with platform metrics before moving hosts. If the endpoint has stopped answering rather than answering late, that’s a quieter, different failure worth ruling out on its own.
One slow route and a whole app slowing at once are different investigations. If every route degrades together once traffic arrives, look first at the shared resources (the connection pool, the instance count, the database) rather than the work inside one handler, and confirm the cause with spans before changing anything; what stalls an AI-built app at a hundred users is the parent question this page sits under. Everything here stays with the timing of a single request path.
Common questions about API response time
What is a good API response time?
There is no universal threshold. Set an objective for each endpoint based on the user action, measure repeated requests over a stated window, and include slow and failed cases. The 100 ms, 1 s, and 10 s perception thresholds describe the whole interaction, not a blanket API target.
What is the difference between API latency and API response time?
Latency is travel time on the wire; response time is that travel plus everything the server does in between. MDN’s latency guide defines network latency as the time for a request to get from the requesting computer to the responding one and back, measured as a round-trip delay. Response time adds the handler’s own work: queueing, authentication, database queries, serialization, and the download of the payload. A route can have low latency and still answer slowly, because a short network path cannot shorten a query that reads too many rows. Measure them separately, because the repairs differ: latency moves with region and connection path, response time moves with the work inside the handler.
Why is my API so slow?
Start with the slow route’s spans. Common causes include excessive rows or payload, N+1 queries, an unsuitable query plan, connection waiting, sequential independent calls, and a slow dependency inline. Deployment region, cold starts, resource limits, and a regression are also possible.
How do I make my API faster?
Measure the browser request, add server spans, reproduce against realistic data, and compare like-for-like requests by route. Then change the slow span and repeat the same test. That avoids “optimizing” a query while the real wait is a third-party API or a connection queue.
Is 500ms slow for an API?
Not by itself. A 500 ms interactive read may be acceptable, while the same time on a tiny internal lookup may signal waste. Judge it in the full user journey and compare the same endpoint and input class over time. Three sequential 500-millisecond calls still create about 1.5 seconds of server wait before other work.
If you have a working app built with these tools and need it ready for real customers, this is what we do.
Built it with AI. Now it has to hold up for real customers.
The Production Hardening Sprint takes the app you already have and builds the production foundation underneath it. Authentication and access rules, payments that stay consistent, error handling, monitoring, backups, automated tests and a documented handover. Our engineers work inside your existing codebase for ten working days. All 123 deliverables are included, and you get the evidence for each one.
See the Production Hardening Sprint →  $2,500 fixed price · 10 working days · One codebase