Core Web Vitals measure loading speed, interaction responsiveness, and visual stability. For an AI-built app, they matter directly on public pages that compete in Search and remain useful product-experience signals inside a login. The measurement method changes between those two surfaces.
The current “good” thresholds are Largest Contentful Paint (LCP) at 2.5 seconds or less, Interaction to Next Paint (INP) at 200 milliseconds or less, and Cumulative Layout Shift (CLS) at 0.1 or less. Google evaluates the 75th percentile of visits, separately for mobile and desktop. Those thresholds come from the current web.dev Core Web Vitals guidance.
Do Core Web Vitals matter for an AI-built app?
Yes, with two different consequences:
| Surface | Why measure it | Best evidence |
|---|---|---|
| Public marketing, pricing, signup, docs, and blog pages | User experience and Google Search page-experience systems | Page-level CrUX when available; origin-level CrUX only as context; lab diagnostics for causes |
| Logged-in product routes | User experience, conversion, and task completion | Your own real-user monitoring, DevTools live metrics, and controlled lab tests |
| New or low-traffic public pages | Establish a diagnostic baseline before enough field data exists | Lighthouse for LCP and CLS diagnostics, DevTools interactions for INP |
The Chrome UX Report methodology says page-level data requires a publicly discoverable page with enough eligible traffic. Google does not publish the exact popularity threshold. An authenticated route may have no page-level CrUX record, yet Chrome can still measure the same vitals in a real session. Your own real-user monitoring can capture those sessions, and eligible origin-level CrUX data has different aggregation rules from an individual URL.
Google says Core Web Vitals are used by its ranking systems, while also warning that good scores do not guarantee a top position. Relevance, content quality, and overall page experience still matter. That is the useful reading of Google’s page-experience guidance: fix genuine user-facing problems and avoid treating three green numbers as an SEO strategy by themselves.
Public pages need Search evidence. Logged-in routes need product evidence. The metrics stay the same, but the measurement source changes.
The three Core Web Vitals and their thresholds
| Metric | Good threshold | What it reveals | Common cause in an app |
|---|---|---|---|
| LCP | 2.5 seconds or less | When the largest visible content element renders | Large images, delayed fonts, render-blocking resources, or a slow server response |
| INP | 200 milliseconds or less | How quickly the page presents the next frame after an interaction | Long JavaScript tasks, expensive rendering, or event handlers doing too much work |
| CLS | 0.1 or less | How much visible content shifts unexpectedly | Images without reserved space, late banners, embeds, or font swaps |
These are field thresholds, not a promise that every visit will land below them. Look at the 75th percentile, split mobile from desktop, and inspect the distribution. A fast laptop on office Wi-Fi can hide the experience of a slower phone.
LCP: trace the element and its delivery path
Start by identifying the LCP element. A hero image may need correct dimensions, responsive sources, compression, and sensible preload behavior. A text block can still arrive late when a web font or server response delays rendering; what a good API response time looks like from the server side is the same wait measured at the other end. If the LCP element depends on client-side data fetching, check whether the page can render useful content sooner. For the images themselves, the image optimization checklist for websites covers dimensions, formats, compression and delivery.
INP: measure an actual interaction
INP needs a real interaction. Lighthouse cannot measure it during a non-interactive page load, so it reports Total Blocking Time as a lab diagnostic instead. Do not label TBT as an INP result. Use Chrome DevTools live metrics while clicking the affected control, or collect real sessions with Google’s web-vitals library.
When INP is poor, record the interaction, the event handler, the longest main-thread task, and the render that follows. Code splitting can help, but the fix may instead be a smaller state update, less work inside an input handler, or virtualizing a large list. How to reduce JavaScript bundle size covers the build output, splitting by route, and lazy loading the rest.
CLS: reserve space before content arrives
CLS often has a mechanical fix. Images and embeds need dimensions or an aspect ratio, and late UI should occupy reserved space where practical.
<!-- The browser can reserve the final shape before the file arrives. -->
<img
  src="https://app.example.com/product-screen.webp"
  alt="Product dashboard"
  width="1200"
  height="675"
/>
Chrome’s CLS optimization guide also covers font loading, dynamically injected content, and shifts that happen after the initial load. Test the whole interaction path, since a layout shift after a click may never appear in a load-only audit.
Which Core Web Vitals tool should you use?
Use this decision sequence instead of copying one Lighthouse score into a report:
- Check field availability. Run the public URL through PageSpeed Insights. Its field section uses CrUX data from the previous 28-day collection period when eligible data exists.
- Separate URL and origin evidence. PageSpeed Insights may show data for the exact URL, the origin, or no field data. Record which one you are reading.
- Use lab data for diagnosis. Lighthouse can reproduce a controlled load and identify LCP and CLS opportunities. Its TBT result is a responsiveness proxy, not INP.
- Exercise the slow flow. Open DevTools performance and live metrics, then perform the click, search, or form action users say is slow.
- Add real-user monitoring where the product matters. Capture metric name, value, route, device class, app version, and a non-sensitive session identifier. Avoid placing personal or secret data in telemetry.
- Verify the fix in both layers. A lab improvement is immediate evidence. CrUX changes lag because its field view uses a rolling window.
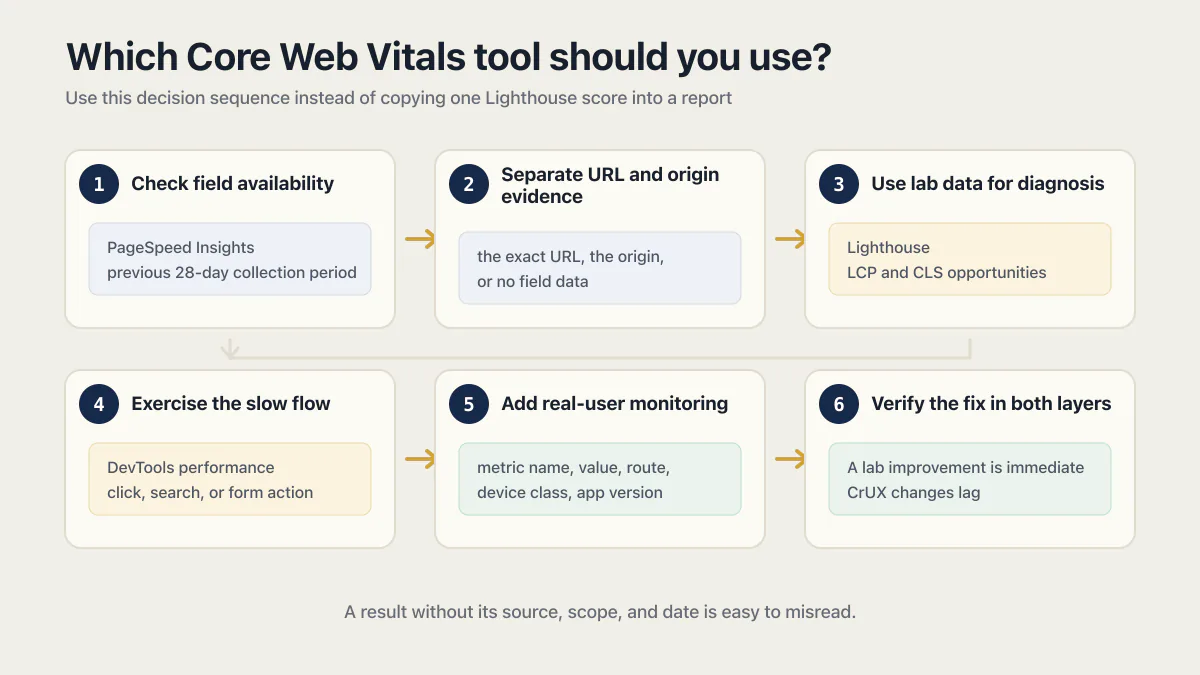
The distinction between field and lab data is central to Google’s PageSpeed Insights documentation and its broader Web Vitals tools workflow. A result without its source, scope, and date is easy to misread. A Lighthouse audit you can repeat, with the pages to test and the median of five runs, has its own page.
Common AI-built app performance failures
AI-generated code has no single performance profile. The output depends on the framework, prompt, components, integrations, and later edits. Review the code that actually shipped. These patterns are worth checking because they can affect Core Web Vitals or the product experience behind them:
- a public route that waits for client-side JavaScript before rendering its primary content;
- a large component library or chart bundle loaded on a page that uses one small widget;
- an unbounded list rendered into the DOM;
- a list whose client rendering triggers one backend query per row;
- a click handler that performs synchronous parsing or triggers broad state updates;
- images fetched at their original size and resized only with CSS;
- loading, consent, or error UI inserted after the layout has settled.
Backend latency also enters the user-visible path when a page waits for data before showing its main content. The one-query-per-row pattern above is common enough across the corpus to carry its own full writeup. A page that re-downloads a full-resolution image or a stale demo dataset on every visit also runs up the hosting bandwidth meter, a cost problem before it becomes a speed problem. Bubble apps hit the identical failure class through their own mechanism, a search with no limit, a lookup running once per row.
These backend problems do not replace Core Web Vitals. They belong in the same trace when they delay rendering or an interaction. If the delay begins at the database, the Supabase performance diagnosis helps separate network time from query work. If it appears only under concurrency, the app-stalling writeup above covers the next layer.
What the audit corpus can and cannot tell us
Across the 21 third-party apps AxonBuild audited in June and July 2026, Performance & Scale averaged 53.3 out of 100 and ranked ninth of 12 audit pillars. That fixed cohort shows that performance weaknesses existed across several layers. It does not establish that AI builders always fail a particular Core Web Vital, and it is not a current benchmark for every platform.
The useful next step is route-specific evidence: the affected URL, the metric source, the slow element or interaction, the backend dependency if one exists, and a before-and-after result. That evidence is more actionable than a generic score that does not explain the route-specific failure. For the controls beyond these three metrics, web performance optimization for an AI-built app covers seven of them, from caching to a load test, with the test for each one.
A Core Web Vitals verification record
For each important route, keep one row with:
| Field | Example |
|---|---|
| Route and surface | /pricing, public |
| Metric and segment | INP, mobile, 75th percentile |
| Evidence source | Page-level CrUX, origin-level CrUX, RUM, DevTools, or Lighthouse |
| Observation window | CrUX rolling period or exact test date |
| Trigger or element | Pricing toggle click |
| Suspected cause | Long state update followed by chart render |
| Change | Memoized chart data and narrowed state scope |
| Verification | DevTools trace now; field result after enough new sessions |
This record prevents an origin-wide field score from being presented as proof about one route. It also keeps a lab improvement from being mistaken for confirmed real-user improvement.
Common questions about Core Web Vitals for AI apps
Does a logged-in dashboard have Core Web Vitals?
The browser can measure LCP, INP, and CLS on an authenticated route. That URL may lack page-level CrUX data because it is not publicly discoverable or does not meet the dataset’s eligibility conditions. Use your own real-user monitoring and DevTools for the logged-in experience.
Can Lighthouse measure INP?
No. INP requires interaction data, and Lighthouse does not interact with the page during its standard load audit. Lighthouse reports Total Blocking Time as a lab diagnostic. Use DevTools while interacting or collect INP from real sessions.
Did INP replace FID as a Core Web Vital?
Yes. INP officially replaced First Input Delay as the responsiveness Core Web Vital on March 12, 2024, per web.dev’s own announcement. A guide still scoring “First Input Delay” is measuring a metric Google stopped using for ranking purposes years ago.
How long does a Core Web Vitals fix take to appear?
Lab and DevTools tests can show the change immediately. PageSpeed Insights field data uses a rolling 28-day period, so the reported field result changes as new eligible visits replace older ones.
Will passing Core Web Vitals make the page rank?
Passing can improve user experience and removes one possible page-experience weakness. Google explicitly says good Core Web Vitals do not guarantee top rankings. The page still needs to satisfy the query with useful, trustworthy content.
What should I fix first?
Start with the important public route or product task that has the clearest real-user problem. Confirm the metric source, reproduce the issue, trace the cause, and verify the change. The broader launch-readiness framework helps place performance beside security, reliability, and data safety. An accessibility audit is a separate check of the same routes: the WCAG AA baseline, the keyboard walk, and the screen-reader pass.
If you have a working app built with these tools and need it ready for real customers, this is what we do.
Built it with AI. Now it has to hold up for real customers.
The Production Hardening Sprint takes the app you already have and builds the production foundation underneath it. Authentication and access rules, payments that stay consistent, error handling, monitoring, backups, automated tests and a documented handover. Our engineers work inside your existing codebase for ten working days. All 123 deliverables are included, and you get the evidence for each one.
See the Production Hardening Sprint →  $2,500 fixed price · 10 working days · One codebase