A slow Bubble app can be doing too much work in one or more of three ways: processing a complex expression, moving too much data, or repeating an otherwise small operation too often. Bubble uses the same framework in its own optimization guidance: complexity, volume, and repetition.
Do not begin by blaming the platform, upgrading the plan, or rewriting every page. First identify where the delay occurs and whether it is browser work, a database search, or a server workflow. Bubble’s App Metrics and server logs can show where workload is spent; a controlled before-and-after test can then show whether a change fixed the bottleneck. For the browser half, the front-end vitals are the measurements to read.
Why is my Bubble app slow?
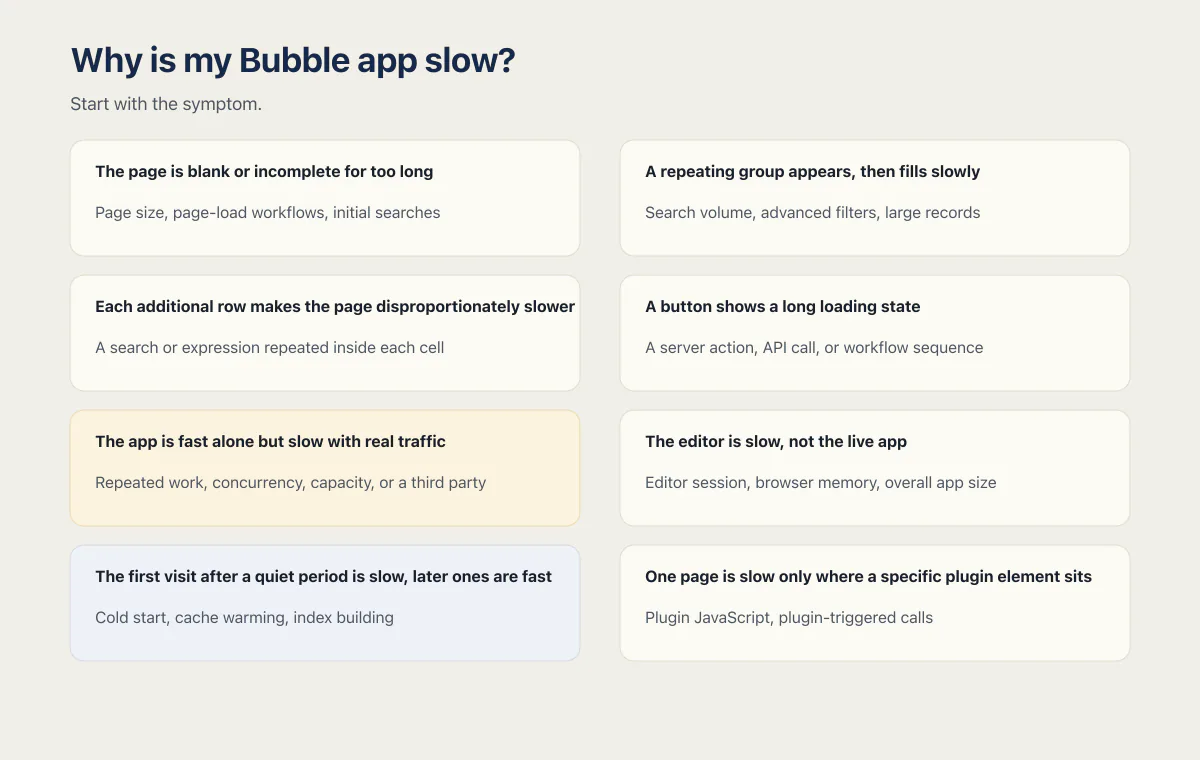
Start with the symptom, because different delays point to different systems.
| Symptom | Likely area | First evidence to collect |
|---|---|---|
| The page is blank or incomplete for too long | Page size, page-load workflows, initial searches | Page-load entries in App Metrics and the browser network timeline |
| A repeating group appears, then fills slowly | Search volume, advanced filters, large records | The exact search, returned row count, and App Metrics search breakdown |
| Each additional row makes the page disproportionately slower | A search or expression repeated inside each cell | Searches embedded in the repeating-group cell |
| A button shows a long loading state | A server action, API call, or workflow sequence | Server logs for that workflow and each action’s workload |
| The app is fast alone but slow with real traffic | Repeated work, concurrency, capacity, or a third party | Live App Metrics by activity plus API and database latency |
| The editor is slow, not the live app | Editor session, browser memory, overall app size | Reproduce the same action on the live version first |
| The first visit after a quiet period is slow, later ones are fast | Cold start, cache warming, index building | Two loads back to back, then one after an idle gap |
| One page is slow only where a specific plugin element sits | Plugin JavaScript and plugin-triggered calls | Browser network timeline for that page |
The AxonBuild audit corpus does not contain a Bubble app, so nothing here is an audit-derived Bubble failure rate. The diagnosis below follows Bubble’s current documentation and database-performance mechanisms that apply regardless of how an app was built.
Treat these as starting hypotheses. A slow page can have more than one cause, and low workload does not guarantee low latency when a browser or third-party API is doing the waiting.
Is Bubble slow, or is my build slow?
Start by testing the build rather than assuming the platform is the cause. Bubble.io runs the search and workflow you configured at the cost that configuration carries. Two apps on the same plan, rendering what looks like the same page, can differ by an order of magnitude in workload because one constrained its searches and the other loaded everything and filtered in the browser. Measure that difference before deciding whether the limiting layer is the query shape or the platform.
The platform does have ceilings, and the honest ones are published rather than folklore. Bubble’s Performance guide names them directly: a recommended soft limit of 1 MB for SVG files, a recommendation against using the :advanced constraint on more than 10,000 things, and rate-limiting once an app exceeds its capacity. Those are specific and testable. “Bubble is bloated” is not.
So ask whether your slow interaction is hitting one of those published ceilings or doing avoidable work on its way to the screen, rather than whether Bubble is fast in general. Measure it once and you know which conversation you are in: tune this build, or accept a real limit and design around it.
Measure the slow interaction before editing it
Bubble’s App Metrics documentation lets you drill into workload by category, workflow, action, and expression. Real-time metrics provide one-minute detail for recent activity. Server logs show server actions and their workload, which is especially useful for isolating a button workflow or backend process.
Use the Debugger to inspect dynamic values, conditions, and workflow execution when the behavior is unclear. Do not treat it as a complete performance profiler. Pair it with App Metrics, server logs, and browser timing so you can tell whether the wait happened in Bubble’s server work, an external API, or the client.
Capture a baseline with a reproducible case:
- Use the same page, user role, data volume, and browser for every run.
- Record the visible wait time and the relevant workload entries.
- Change one suspected cause at a time.
- Repeat the same interaction and compare both time and workload.
Without that baseline, a page can feel faster because its data was cached or the test account was smaller, while the underlying scaling problem remains.
Safe fixes to try in the next 30 minutes
If the app is slow right now and users are complaining, you do not have to finish the measurement before you touch anything. These five changes are cheap, hard to get wrong, and none of them rewrites your data model or your workflows. Do them while you set up the baseline, then measure both sides anyway.
- Compress the largest images on the slow page and upload them close to the size they actually display at.
- Uninstall plugins the app no longer uses.
- Delete or defer any page-load workflow that is not needed before the user sees the page.
- Add an explicit limit to the biggest repeating group’s search.
- Replace one client-side
:filteredwith a database constraint on the search itself.
Why does my Bubble page take so long to load?
Bubble defines a fresh page load as three kinds of work: generating and sending the page, loading its data and dynamic expressions, and running page-load workflows. Its page-load checklist recommends limiting initial data, using pagination or infinite scrolling, making searches precise, deferring data until it is needed, and consolidating redundant searches.
Inspect these areas in order:
- Page-load workflows that search, aggregate, or call external APIs.
- Repeating groups and summary numbers that load before the user needs them.
- Hidden elements whose conditions still allow their data to load.
- Large images, fonts, scripts, and an excessive number of elements.
- Repeated navigation that triggers page-load events more often than expected.
Images deserve their own pass, because they are the easiest weight to shed. Upload files already compressed and sized close to the dimensions they render at: a 4000 pixel photograph shown in a 400 pixel card still makes the visitor download all 4000 pixels, and on a phone connection that is the difference between a page that paints and a page that hangs.
Deferral is often safer than deletion. Move a nonessential report, tab, or aggregation behind a user action, then verify that the data truly does not load before its container becomes visible.
Plugins: measure work outside Bubble’s server numbers
Plugins deserve a separate browser check because their client-side cost may not appear in Bubble’s server workload figures. Bubble’s Performance guide is blunt about the mechanism: a plugin’s code is included on each page load whether or not the page uses it, and it recommends uninstalling plugins the app is not using. Bubble notes the impact is smaller when the plugin is never rendered, but the code still travels with the page. A plugin left behind after the feature it powered was abandoned is still shipping JavaScript to every visitor.
Three things follow:
- Every plugin element you place adds that plugin’s script to that page.
- A plugin action can fire an external API call during page load, so the user waits on a third party before the page is usable.
- None of that necessarily shows up as Bubble workload. When the wait is the browser parsing script or a third party responding slowly, App Metrics can look calm while the page feels broken.
Fix path: open the plugin list, remove what nothing uses, then load the same page again with the browser network timeline open. The scripts that disappear are the ones you were paying for.
Slow repeating groups: separate volume from repetition
A repeating group can be slow because its parent search returns too much data, because each cell is expensive to render, or because each cell launches more searches. Those problems need different fixes.
Nested repeating groups deserve a separate warning. Bubble points out that nesting has a multiplicative effect on element count rather than an additive one: a 20 row group whose cells each hold a 10 row group is 200 cells of rendering work, not 30.
The parent search returns too much
Apply specific database constraints before using client-side filtering, and return only the rows the interface can reasonably display. Bubble’s optimization checklist warns that advanced :filtered and :advanced operations can substantially increase workload. It also recommends reducing data volume and avoiding nested searches.
Pagination and infinite scrolling reduce the initial result set. A repeating group’s layout alone is not proof that its underlying expression is bounded, so confirm the number of records requested and loaded in the case you are testing.
Each cell performs another search
Bubble explicitly calls out searches inside repeating-group rows. A second search in every cell can turn one list request into one parent request plus one lookup per displayed row, the same shape as the N+1 query problem on a coded stack, minus the ORM that would otherwise hide it.
Move the related lookup outside the cell when possible. Load the needed relation once and hold it in a custom state so each cell reads from memory instead of the database, or restructure the data so each cell can display a field already available from its parent thing. Then repeat the test at 10, 50, and 100 visible rows. If the fix is real, server work should not grow by one extra search per row.
I watched this exact shape play out on a different stack. One of the 26 apps in the audit corpus, a motorsport-favorites dashboard with no connection to Bubble, had a drivers page that called the underlying API with no filter, then deduplicated the result with a nested scan in the browser. Fine on a demo season; as real seasons accumulated, the page slowed further on every load, and only the row count had changed. Point a Bubble repeating group at a list built the same unconstrained way and the same failure appears in Bubble’s vocabulary instead of a stack trace.
Repeating-group performance depends on how much new work each additional row creates.
The cell itself is heavy
Even without nested searches, a cell with many elements, images, conditional expressions, and linked fields can make the browser do substantial work. Compare a minimal cell against the full design using the same result set. If workload remains similar but rendering time drops, simplify the cell and image payload rather than tuning the database search.
Reusable elements are worth naming here, because they are often misread as a performance fix. They give you one definition to maintain instead of many copies, which is a real benefit for a header, a menu, or a card design used across pages. A reusable element sitting inside a repeating-group cell is still rendered once per row. It reduces build sprawl rather than per-row work.
Why are my Bubble searches slow?
An unconstrained Do a search for followed by a client-side filter may load far more records than the user ever sees. Prefer constraints Bubble can apply while finding the data. Bubble’s current search optimization guidance notes that it indexes database searches as data volume grows, that identical element searches on one page are generally performed once, and that searches inside workflows repeat each time the workflow executes.
That last distinction matters. Copying the same search into three visual elements may be cheaper than three almost-identical searches, while placing it in a workflow that fires repeatedly can multiply the cost. Look for Page is loaded, Do every X seconds, and conditions that become true more often than intended.
Bubble also publishes two soft limits worth knowing before you conclude the platform is the problem. Its Performance guide recommends against using the :advanced constraint on more than 10,000 things, and recommends a soft limit of 1 MB for SVG files, because a larger file slows the local device down while it is processed. If your search is running :advanced over a table that crossed 10,000 rows this quarter, you have found a published ceiling rather than a mystery.
Do not weaken privacy rules to make a search faster. Privacy rules are an authorization boundary. Optimize the query and data model around that boundary, then confirm with two accounts that the resulting records and fields remain inaccessible where required.
Slow button or backend workflow: use the server log
When the page loads quickly but an action waits, inspect the workflow rather than the page. Server logs can reveal which server-side actions ran and the workload they consumed. Then check for:
- A search repeated in multiple conditions or actions.
- A list operation whose cost grows with the number of records.
- Recursive or frequently scheduled workflows.
- Sequential API calls that could be reduced or moved off the user-facing path.
- Retries, timeouts, or a slow third-party response.
- A page action waiting for work the user does not need immediately.
Recursive and scheduled workflows cut both ways. Firing more often than intended, they are a cause of slowness. For a large list change they are also the standard fix: Bubble gives you Schedule API Workflow on a list, and the recursive pattern where a backend workflow processes one chunk and schedules its own next run. Both move the loop off the user-facing path, so nobody sits watching a spinner while 8,000 records update. Use them deliberately, and check the schedule frequency of any that already exist.
Workload and latency are related but not identical. An external API can be slow with modest Bubble workload, while a fast server operation can still consume significant workload when repeated thousands of times. Record both.
Workload units, capacity, and throttling
Workload and capacity are two different meters, and confusing them costs weeks.
Workload is measured in workload units. Bubble describes a unit as a weighted measure of the scarce resources its systems use, including server CPU time, database CPU time, and other backend systems. Capacity is the separate constraint: how much your app is allowed to do at once. When capacity is exceeded, Bubble rate-limits the app, which means it cannot do as much in a given period and user requests are effectively slowed down. An app spending near its maximum allotted capacity may also be throttled to keep it running without exceeding that ceiling.
That is the mechanism behind “fast for me, slow in production”. The inefficient page was always inefficient. Traffic pushed it past the point where the platform starts holding requests back, and the wait that was previously invisible became everyone’s problem at once.
One consequence is worth stating plainly: on a metered plan, a slow app and an expensive app are usually the same bug. The workload number is both the diagnostic and the bill. A repeating group that pulls 5,000 rows to display 20 of them charges you for 5,000 rows every time somebody opens that page, and it will keep doing that whether or not anyone complains about speed.
How much those units actually cost, tier by tier, is a separate question from why they are being spent, so work out the cause here and price the plan against the workload you genuinely need.
Slow only under traffic: test the app, database, and dependencies together
If a workflow is fast in isolation and slow only with concurrent users, a larger plan may provide more capacity, but it will not make an inefficient operation cheaper. First determine whether the constraint is Bubble capacity, database work, a rate-limited external API, or client rendering.
Create a staged test in a non-production environment with representative data and user journeys. Increase concurrency gradually while watching workload, errors, API latency, and user-visible response time. Avoid a synthetic test that only requests a static page; it measures delivery infrastructure rather than the dynamic routes and workflows users rely on.
Why an AI-built app stalls at 100 concurrent users covers the same platform-independent mechanisms in coded stacks: unbounded work, per-row queries, limited connection pools, and dependencies that fail before the application server does.
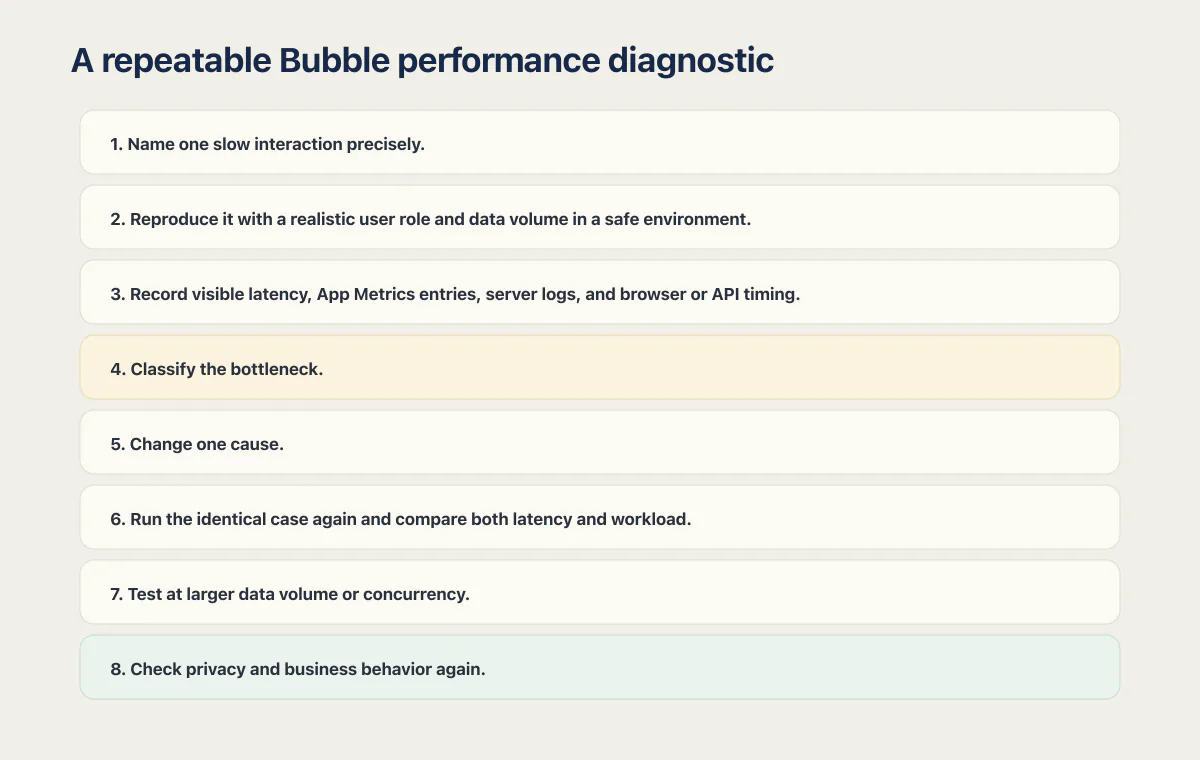
A repeatable Bubble performance diagnostic
- 01 Name one slow interaction precisely, such as opening Orders or clicking Generate report
- 02 Reproduce it with a realistic user role and data volume in a safe environment
- 03 Record visible latency, App Metrics entries, relevant server logs, and browser or API timing
- 04 Classify the bottleneck as page delivery, data volume, repeated work, server workflow, browser rendering, or third-party latency
- 05 Change one cause, such as adding a database constraint or removing a per-cell search
- 06 Run the identical case again and compare both latency and workload
- 07 Test at larger data volume or concurrency to confirm the improvement scales
- 08 Check privacy and business behavior again so the optimization did not weaken a required control
The goal is predictable performance without sacrificing correct data, permissions, or user experience. A build hurried enough to skip a search constraint often skips other guardrails too: the data-loss bugs hiding in an AI-built app covers that side, and performance is one part of whether the app is ready for real users rather than the whole answer.
If the diagnostic keeps landing on the data model rather than one search, the honest next step is hiring a Bubble developer who has fixed this shape before, because what is left is a restructure and not a setting.
Common questions about slow Bubble apps
What are the common causes of a slow Bubble app?
The common categories are a heavy page load, excessive search volume, repeated searches or workflows, expensive browser rendering, slow external services, and capacity pressure. Use the symptom plus App Metrics and server logs to identify which one applies before changing the build.
Is Bubble.io slow, or is it my build?
Treat the build as the first hypothesis rather than as a prevalence conclusion. Bubble runs the workflow and search you configured at the cost that configuration carries, and two apps on the same platform can differ sharply because their searches differ. Measure the slow interaction before deciding that either the build or the platform is the ceiling.
How do I speed up a Bubble repeating group?
Constrain and limit the parent search, use pagination or infinite scrolling, remove searches from inside each cell, and simplify heavy cell content. Test the same group at increasing row counts to see whether work grows linearly per row.
Does upgrading a Bubble plan make an app faster?
More capacity can help when the app is actually capacity-bound. It does not remove nested searches, advanced filters, repeated workflows, slow APIs, or heavy client rendering. Note that extra capacity and a dedicated instance are different purchases: Bubble says a dedicated instance helps mainly through geography, faster heavy data operations, and stability. Measure first so the spend addresses the limiting resource. What each Bubble plan includes, and what extra workload costs on top of it, is a pricing question rather than a performance one.
Can a Bubble app scale?
Yes, but there is no universal user-count guarantee. Scalability depends on data volume, query shape, workflow frequency, page complexity, third-party limits, and available capacity. Test the app’s own important journeys with representative data and concurrency.
Do plugins slow down a Bubble app?
They can, and the cost is easy to miss. Bubble includes a plugin’s code on each page load whether or not that page uses it, so a plugin left behind after its feature was dropped still ships JavaScript to every visitor, and a plugin action that calls an external service during page load makes users wait on a third party. Uninstall what nothing uses, then reload the same page with the browser network timeline open and see which requests disappeared.
Why is my Bubble app slow on the first load and fast afterwards?
That pattern usually points at warming rather than a broken build: browser and CDN caches are empty on the first hit, Bubble builds search indexes as data grows and searches repeat, and any external service in the path may be cold too. Confirm it by loading the page twice back to back, then again after an idle gap, and comparing the three. Device-side throttling looks identical from the outside, so check whether the slow phone was in battery-saver mode before you change anything in the app.
Is the Bubble editor slow or is my live app slow?
They are separate problems with separate fixes, and the same complaint gets used for both. Editor lag is usually about the size of the app you have open, the number of elements on the page you are editing, and the memory available on your own machine, and your users never experience it. Live app slowness is what visitors get on the deployed version, so reproduce the complaint on the live version first and only then decide which problem you are solving.
Should I remove privacy rules to improve Bubble performance?
Keep privacy rules as a required authorization boundary. Improve constraints, data shape, repeated work, and page behavior while keeping access controls intact, then verify the result with users who should and should not see the data.
If you have a working app built with these tools and need it ready for real customers, this is what we do.
Built it with AI. Now it has to hold up for real customers.
The Production Hardening Sprint takes the app you already have and builds the production foundation underneath it. Authentication and access rules, payments that stay consistent, error handling, monitoring, backups, automated tests and a documented handover. Our engineers work inside your existing codebase for ten working days. All 123 deliverables are included, and you get the evidence for each one.
See the Production Hardening Sprint →  $2,500 fixed price · 10 working days · One codebase