Key numbers from this study:
- 22 of 26 AI-built apps had at least one confirmed-critical finding.
- At least 23 of 26 had no working automated tests.
- 958 confirmed findings across the 21 third-party apps, 58 of them critical.
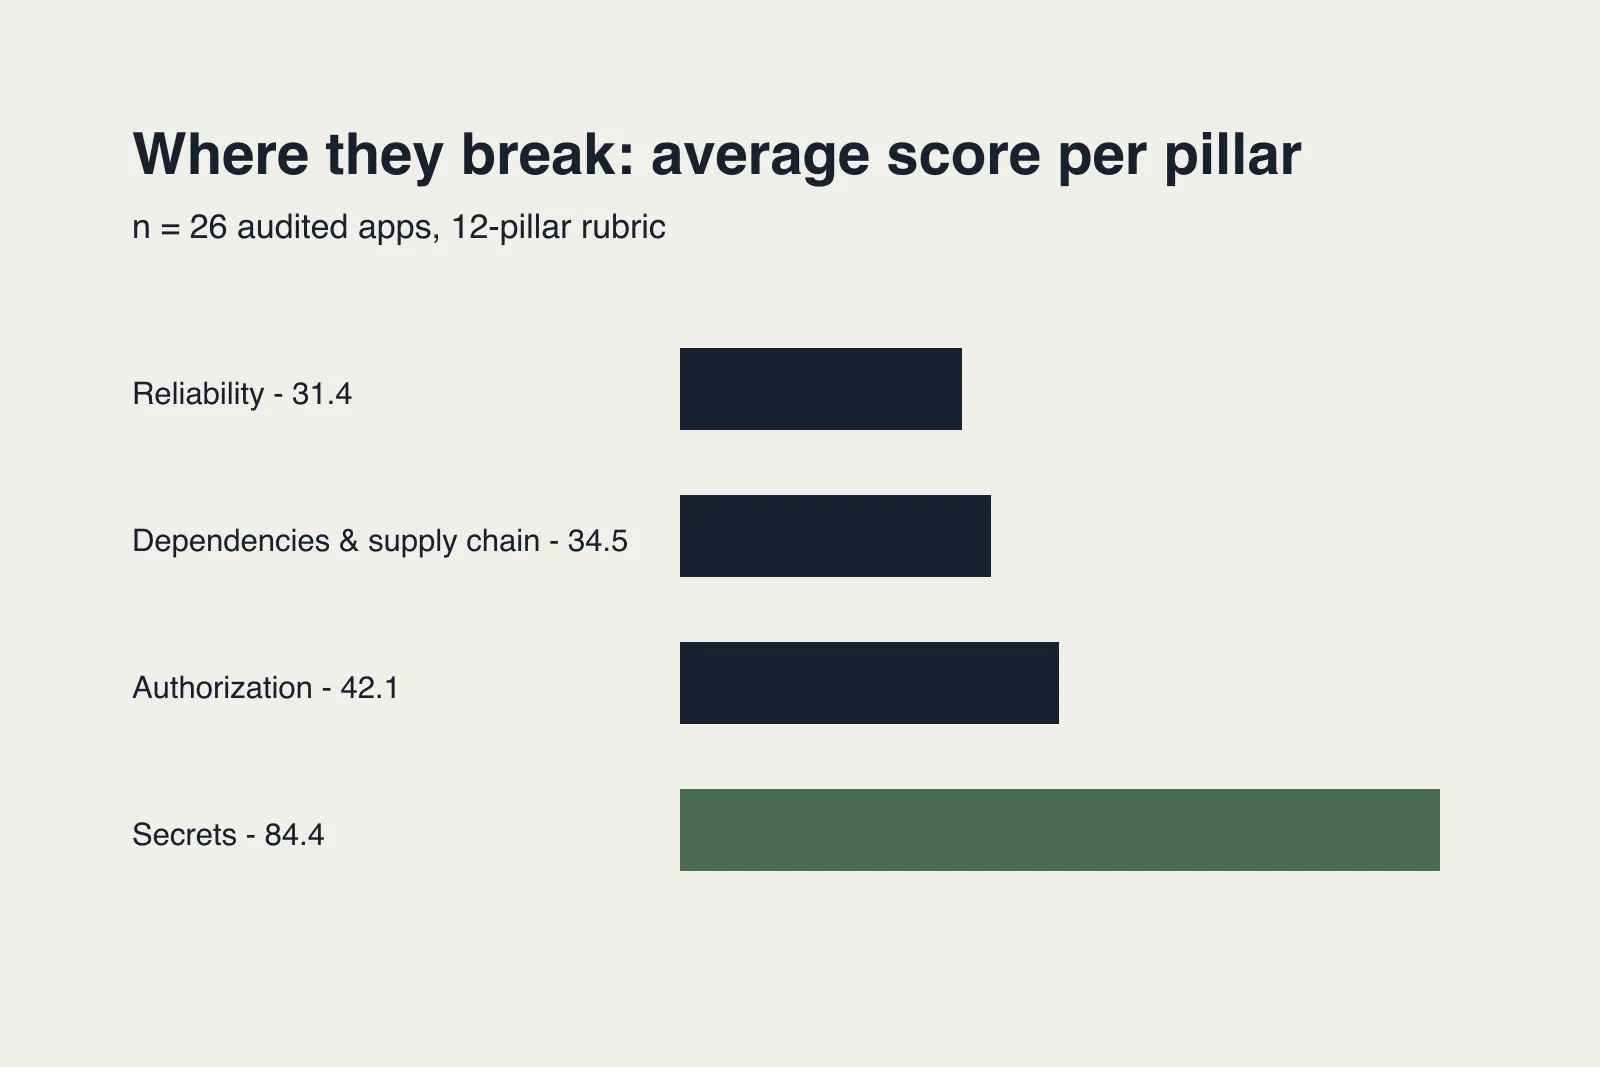
- Weakest audit area: reliability and correctness, 31.4 out of 100.
- Strongest audit area: secrets and credentials, 84.4 out of 100. Leaked API keys were not the main failure mode.
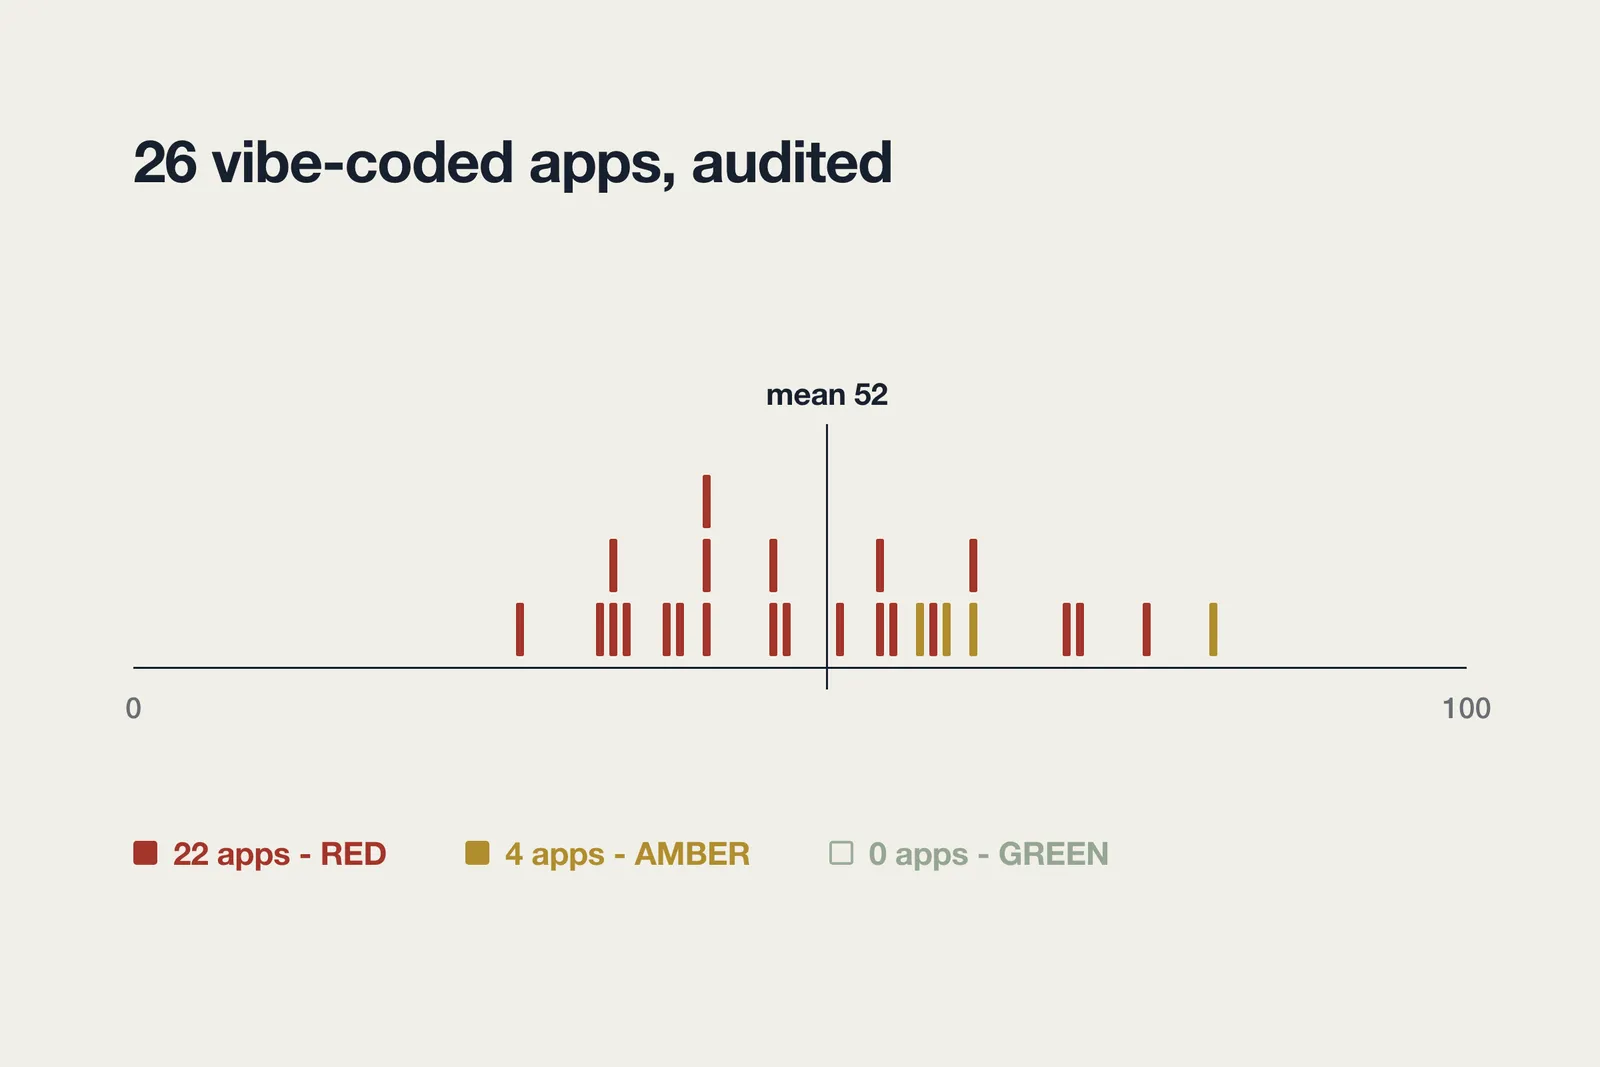
Those numbers come from a fixed June and July 2026 study of 26 AI-built applications. None of the 26 reached the study’s green band. Scores in the historical research model ranged from 29 to 81 out of 100, with a mean of 52.1 and a median of 51.
These results describe this selected corpus. They are not an estimate of the failure rate across every vibe-coded app, and the 26-app denominator will not grow when AxonBuild reviews more apps. Keeping the cohort fixed makes its figures reproducible instead of silently changing the study after publication.
The score and red, amber, and green bands below belong to the historical research model used for this corpus. They do not describe a current service, certification, or safety verdict.
Readers who want to know what a review of a vibe-coded app actually checks, and what it leaves out, are looking for the vibe coding security audit guide rather than this study. This page is the dataset, not the procedure.
Corpus methodology and dated snapshots
The app-audit corpus is fixed at 26 AI-built apps reviewed in June and July 2026: 21 third-party public repositories and five founder-owned production apps. An audit engine generated candidate findings. A finding entered the study only after its mechanism was checked against the code, tied to file-and-line evidence, and challenged with a refutation attempt. Git-history findings also required commit evidence. Published results identify neither repositories nor clients and include no client-identifying detail.
The community-post corpus is separate. COMMUNITY-1255 is a one-time snapshot of 1,255 public builder posts and comments read on 14 August 2026. A later snapshot held 1,283 rows carrying a quoted post on 15 August 2026; the web-app-versus-native article uses that later snapshot. These dated reading sets are not random samples or measures of how common a problem is. Each article’s count is bound to the snapshot date and local matching rule it states.
Vibe-coded app security statistics at a glance
Table 1. Study denominators: 26 AI-built apps reviewed in June and July 2026, of which 21 were third-party public repositories and 5 were founder-owned. Every row using a narrower base prints that base in the cell.
| Metric | Historical result |
|---|---|
| Apps reviewed | 26 (21 third-party apps, 5 founder-owned apps) |
| At least one confirmed-critical finding | 22 of 26 |
| Historical band | 22 red, 4 amber, 0 green |
| Historical score distribution | 29 to 81 out of 100; mean 52.1, median 51 |
| Confirmed findings in third-party cohort | 958 across 21 apps, including 58 critical |
| No working automated tests | at least 23 of 26 |
| No error tracking or alerting | 17 of 21 third-party apps |
| Held-out verification | 10 disjoint apps; zero reported findings failed verification, recall 1.0 against curated ground truth |
Twenty-two of 26 apps had a confirmed critical. The sample is small, selected, and detailed enough to show exactly which mechanisms produced that count.
Vibe coding security statistics from other studies (2025 to 2026)
AxonBuild’s 26 apps are one data point. Here is the wider evidence base people usually mean when they search for vibe coding security statistics, with the denominator and the method attached to every headline number.
Table 2. Every row carries its own denominator in the Apps or samples column and its own method in the last column, so the headline numbers are not comparable across rows. The AxonBuild row is 26 apps reviewed in June and July 2026.
| Study | Apps or samples | Date | Headline number | Method |
|---|---|---|---|---|
| Escape | 5,600+ public apps built on vibe coding platforms | 2025 | More than 2,000 vulnerabilities, 400+ exposed secrets, 175 instances of exposed personal data | Automated external scanning of live endpoints |
| Symbiotic Security, “We scanned 1,072 vibe-coded apps” (2026, search the title to find it) | 1,072 Supabase-backed apps, from 65,643 crawled URLs | 2026 | 98% had at least one issue, 16% had a critical, only 26 apps came back clean | Automated external scanning |
| Veracode GenAI Code Security Report | 100+ models across 80+ coding tasks | 2025 | 45% of samples introduced an OWASP Top 10 flaw; 86% failed to defend against cross-site scripting (CWE-80); 88% failed log injection | Fixed benchmark tasks scored by static analysis |
| Apiiro | Enterprise repositories under AI-assisted commits | 2025 | Commits 3 to 4x faster, monthly security findings up roughly 10x in six months, privilege-escalation paths up 322%, architectural flaws up 153% | Commit-level analysis of real repositories |
| Georgia Tech Vibe Security Radar | Public CVE and advisory feeds | Through Mar 2026 | 74 AI-linked CVEs confirmed; 35 appeared in March 2026 | Finds the bug in source, then uses code history to identify the introducing commit and AI signature |
| Spracklen et al., USENIX Security 2025 | 16 models, 576,000 generated code samples | 2025 | 19.7% of recommended packages did not exist, 205,474 unique hallucinated names | Package names resolved against real registries |
| Pearce et al., “Asleep at the Keyboard” | 1,689 generated programs across 89 scenarios | 2021 | About 40% of the programs were vulnerable | Completion prompts targeting the CWE Top 25 |
| Perry et al., “Do Users Write More Insecure Code with AI Assistants?” | Controlled user study | 2023 | Participants with an AI assistant wrote significantly less secure code and were more confident it was secure | Lab study with security-relevant programming tasks |
| SusVibes benchmark | 200 feature-request tasks from open-source projects | 2025 | For the strongest agent tested, 61% of solutions were functionally correct and only 10.5% were secure | Benchmark of agent-generated patches on open-source projects |
| This study (AxonBuild) | 26 AI-built apps | Jun to Jul 2026 | 22 of 26 had a confirmed-critical finding | Manual code-level verification with a refutation attempt per finding |
Those numbers do not agree with each other, and they are not supposed to. Each one counts a different thing. Escape and Symbiotic Security scan live apps from the outside, so they measure what is exposed on the public internet. Veracode, SusVibes, and the two academic studies score generated code against fixed tasks, so they measure what a model writes before anyone reviews it. Georgia Tech counts published CVEs, which is the narrowest denominator of all. A number is only useful with its denominator attached.
Two of the widely quoted figures deserve a correction. The “89.5% of vibe-coded apps are insecure” line traces back to the SusVibes benchmark, where 10.5% of agent-generated patches were secure across 200 coding tasks. That is a per-task rate on a benchmark, not an app-level failure rate in production. The “40%” often credited to Stanford is from the 2021 Pearce et al. Copilot study at NYU. The Stanford study, by Perry and colleagues, is a user study with a different finding entirely: people using an AI assistant wrote less secure code and trusted it more.
The supply-chain result is the one most teams have never heard of. Slopsquatting is the attack built on it: models invent package names, 43% of the sampled invented names reappeared in all ten repeat queries, and an attacker who registers a name that a model reliably hallucinates gets installed by anyone who pastes the suggestion. Dependencies and supply chain was the second-weakest area in the AxonBuild cohort at 34.5 out of 100.
How the 26 apps were selected and checked
The study has three cohorts. Eleven public third-party repositories formed the deep-audit set used to build the pattern library. Ten different third-party repositories formed a held-out validation set that the engine had not seen while the method was being developed. Five founder-owned production apps were then reviewed through the same process.
Table 3. The three cohorts inside the 26. Any figure quoted on this page as “of 21 third-party apps” means the 11 deep-audit apps plus the 10 held-out apps, and excludes the 5 founder-owned ones.
| Cohort | N | Role in the study |
|---|---|---|
| Deep-audit corpus | 11 | Exhaustive review across all 12 applicable readiness areas; source of the initial pattern library |
| Held-out validation | 10 | Disjoint third-party apps reviewed after the pattern library was built |
| Founder-owned apps | 5 | Production apps built by the founder, included as a separate dogfooding cohort |
The audit engine generated candidate findings. A finding entered the study only after its mechanism was checked against the code, attached to file and line evidence, and subjected to a refutation attempt. Git-history findings also required the relevant commit evidence. The deep-audit set later passed 36 additional automated re-verification runs with no reported regression. This process supports the findings in the selected repositories; it does not turn the sample into a random survey.
The 21 third-party apps produced 958 confirmed findings: 58 critical, 362 medium, 403 smell, and 135 hygiene. The pattern counts below come from a distilled 420-finding ledger, so some are explicitly lower bounds rather than exhaustive prevalence counts.
Pillars that did not apply to an app were excluded. An app without payments did not receive a zero for revenue and billing, and an app without an AI surface did not receive a zero for AI-specific risk. That is why pillar denominators differ.
How bad were the scores? 29 to 81 out of 100
The lowest score, 29, belonged to a medical-advice app with plaintext patient records and a reachable account-takeover path. The highest, 81, belonged to a thin freelancer dashboard with no real backend. Its small attack surface helped the score, while its unfinished product paths kept it out of the green band.
The mean of 52.1 and median of 51 are close, but the study does not publish enough distributional detail to infer a population shape beyond this cohort. The defensible conclusion is narrower: serious findings appeared across the selected apps rather than depending on one low-scoring outlier. Vibe coding examples from the corpus owns the app-by-app stories; this page owns the aggregate ledger.
Which historical audit areas were weakest
Reliability, dependencies, and deployment operations scored lower than secrets management in this cohort. The result runs against the common assumption that exposed API keys are the main failure mode in AI-built apps.
Table 4. Each average covers only the apps eligible for that area, and the Eligible apps column is that row’s denominator. Areas that did not apply to an app were excluded rather than scored zero, which is why the denominators differ.
| Rank | Historical audit area | Average score | Eligible apps |
|---|---|---|---|
| 1 | Reliability and correctness | 31.4 | 21 |
| 2 | Dependencies and supply chain | 34.5 | 20 |
| 3 | Deployment and operations | 37.0 | 21 |
| 4 | AI and LLM risk | 38.4 | 14 |
| 5 | Authorization | 42.1 | 14 |
| 6 | Revenue and billing | 42.7 | 3 |
| 7 | Data integrity and safety | 51.6 | 20 |
| 8 | Authentication | 52.8 | 14 |
| 9 | Performance and scale | 53.3 | 21 |
| 10 | Maintainability and evolvability | 61.1 | 21 |
| 11 | Input, injection, and abuse | 61.9 | 21 |
| 12 | Secrets and credentials | 84.4 | 21 |
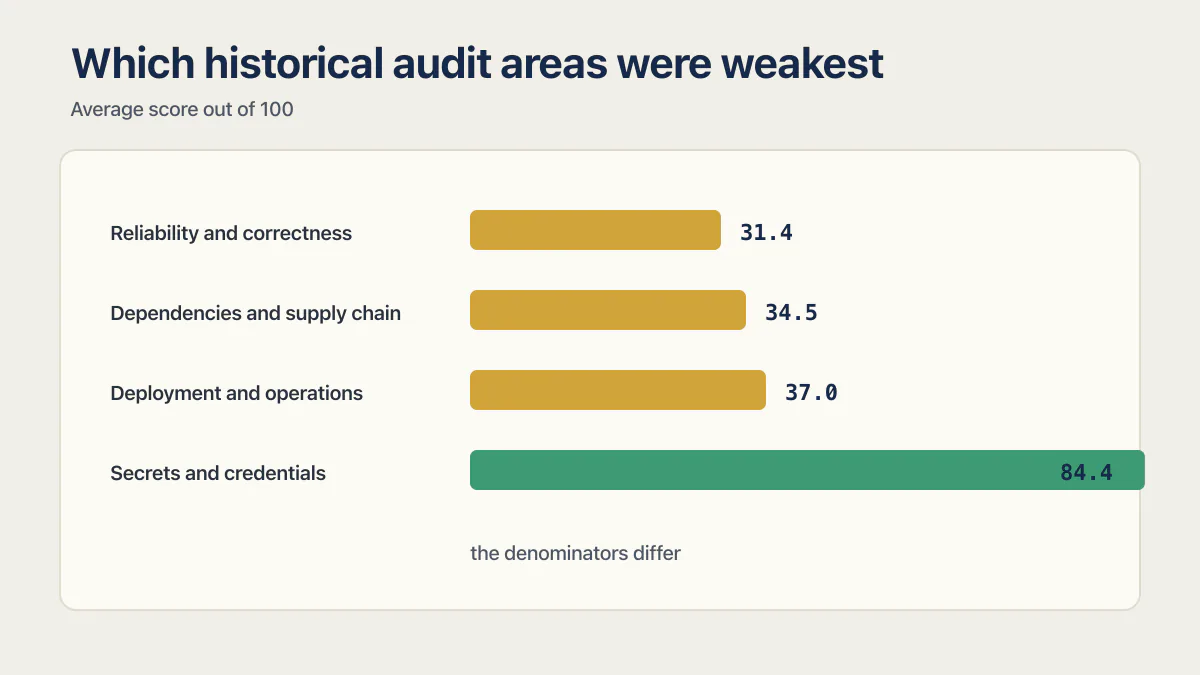
The three-app revenue sample is too thin for a category claim. The reliability, deployment, and secrets rows use much broader eligibility and support a more useful observation: most apps kept credentials in environment variables, while tests, monitoring, deploy gates, and authorization behavior often went unverified.
Input, injection, and abuse scored 61.9. That area covers the classic injection classes: SQL injection, cross-site scripting (XSS), and command injection. A mid-table result looks odd next to Veracode’s finding that 86% of AI-generated samples failed to defend against cross-site scripting. The two are measuring different things. Veracode scores raw model output on a task designed to invite the flaw. AxonBuild scores a shipped app, where the framework usually escapes output and parameterizes queries whether the builder understood that or not. Framework defaults, not model behavior, are doing most of the work in that row.
Twelve recurring failure patterns
The rows are ordered by the source ledger’s frequency ranking. Each rate keeps the denominator that was actually eligible for that finding.
Table 5. Every rate carries its eligible base: all 26 apps, the 21 third-party apps, the 5 founder-owned apps, or the 14 third-party apps with an AI surface. Restating any of these rates over 26 makes the statistic wrong.
| Failure pattern | Historical rate | OWASP or CWE class |
|---|---|---|
| Zero working automated tests | at least 23 of 26 apps | No standard class; a process gap, not a vulnerability |
| No error tracking or alerting | 17 of 21 third-party apps | A09 Security Logging and Monitoring Failures |
| No deploy gate before production | at least 17 of 21 third-party apps; also 5 of 5 founder-owned apps | A05 Security Misconfiguration |
| AI denial-of-wallet path | 12 of 14 third-party apps with an AI surface | LLM10 Unbounded Consumption; CWE-770 |
| No rate limiting on the costliest endpoint | 13 of 21 third-party apps | CWE-770 Allocation of Resources Without Limits or Throttling |
| Unauthenticated endpoint performing privileged work | 11 of 21 third-party apps | A01 Broken Access Control; CWE-306 Missing Authentication for Critical Function |
| Cross-user or cross-tenant data access | 7 of 21 confirmed; RLS gaps in 9 of 21 | A01 Broken Access Control; IDOR or BOLA; CWE-639 |
| Server trusts a browser-supplied fact | 10 of 21 third-party apps | CWE-602 Client-Side Enforcement of Server-Side Security |
| Reachable, publicly known critical CVE | 9 of 26 apps | A06 Vulnerable and Outdated Components |
| Real secret committed or shipped | 6 of 21 third-party apps | CWE-798 Use of Hard-coded Credentials |
| Live prompt-injection path | 8 of 14 third-party apps with an AI surface | LLM01 Prompt Injection |
| PII or PHI exposure | at least 5 of 21 third-party apps | A02 Cryptographic Failures (sensitive data exposure) |
The A-numbers are the OWASP Top 10 for web applications in its 2021 edition, kept because the historical sources this table draws on report by those labels, the LLM-numbers are the OWASP Top 10 for LLM Applications 2025, and the CWE numbers are the Common Weakness Enumeration entries. The mapping is there so these rows can be compared against studies that report by class. It is a translation, not a claim that every row is a one-to-one match.
“At least” marks a lower bound from the distilled ledger. The AI-specific rows use 14 because only 14 third-party apps exposed an AI or LLM feature. Replacing those denominators with 26 would inflate the apparent coverage and make the statistic wrong.
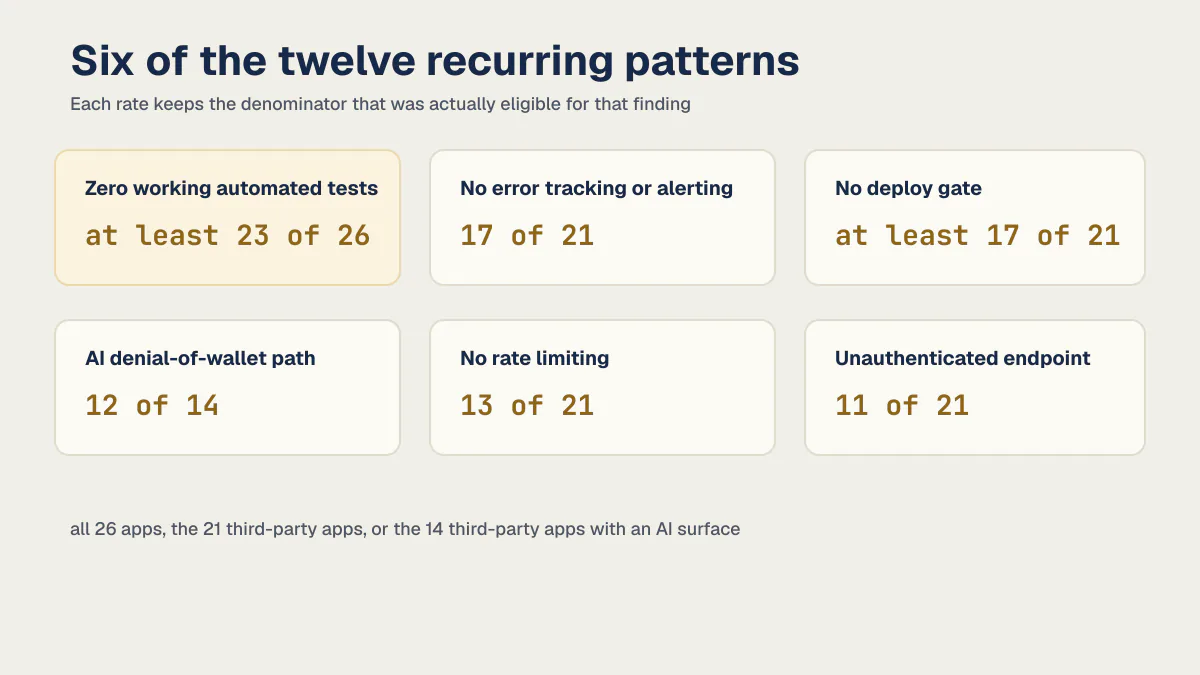
The mechanisms connect. An unauthenticated AI endpoint without rate limiting creates a direct cost-abuse path. A request that checks login but never checks ownership creates cross-customer access. A deploy flow with no tests or monitoring lets both failures survive a working demo. Why AI coding tools miss these security boundaries explains the mechanism; vibe coding security risks owns the broader risk guide.
Production hardening: the three rows to fix first
Production hardening for a vibe-coded app is mostly these three rows, in this order. None of them require rewriting the product.
- Put a gate in front of production. At least 17 of 21 third-party apps had no deploy gate, and so did all five founder-owned apps. One CI job that runs the test suite and a dependency check before a deploy is allowed closes the widest hole in the study.
- Turn on error tracking and alerting. 17 of 21 third-party apps had none. Without it, a failure only surfaces when a customer complains, which means the mean time to notice is measured in days.
- Rate-limit the costliest endpoint. 13 of 21 had no rate limit on their most expensive endpoint, and 12 of 14 apps with an AI surface had a denial-of-wallet path (also searched as API cost abuse or an unmetered LLM endpoint). A per-key and per-IP cap on the endpoint that calls a paid model is a one-file change.
These three are the operational half. The authorization rows, broken access control and IDOR, need code changes and belong in a separate pass.
What the scans got wrong: flagged CVEs that were not reachable
A dependency scanner counts advisories. It does not check whether the vulnerable code path is reachable from the running application. In this cohort the gap between those two numbers was large.
Table 6. Advisory count and verified reachable path are separate measurements over the same apps. The base is the 21 third-party apps in the first two rows and all 26 apps in the third.
| What a dependency scanner flagged | What was reachable in the running app |
|---|---|
| 33 to 44 known CVEs each, in 3 of 21 third-party apps | Zero reachable vulnerable paths in all three |
| Advisories across the rest of the third-party set | At least one confirmed reachable known vulnerability in 8 apps |
| Advisories across all 26 apps | A reachable, publicly known critical CVE in 9 of 26 |
Read the top row carefully. Three apps carried a scanner report showing dozens of known CVEs, and none of those advisories corresponded to code the application could actually execute with attacker-controlled input. If you ship on a scanner count alone, you will spend a week upgrading packages that were never exploitable while an unauthenticated endpoint sits untouched.
The reverse error is worse. Eight apps had a confirmed reachable known vulnerability, and a scanner alone could not tell you which of its many rows those were. Advisory count and verified exploit path are two different measurements, and this study kept them in separate columns on purpose.
Which known CVEs were actually reachable
Nine of the 26 apps had a reachable, publicly known critical CVE, and every one of those nine was an ordinary application-dependency CVE rather than a platform CVE. I do not publish the per-app identifiers: the third-party cohort is public repositories that are still online, and naming the CVE next to the app would be a live exploitation pointer. What can be published is the class, and how it lines up with the platform-level CVEs the field already knows.
- CVE-2025-48757, the reported Lovable Row Level Security bypass. The original disclosure reported that insufficient RLS policies left 303 endpoints across 170 Lovable projects readable with a public anonymous key. The NVD record marks this CVE as disputed by the supplier. The reported mechanism matches the cohort’s RLS-gap row: 9 of 21 third-party apps had an RLS gap, and 7 of 21 had confirmed cross-user or cross-tenant data access.
- CVE-2025-54135 (CurXecute) and CVE-2025-54136 (MCPoison), both in the Cursor editor. Indirect prompt injection writes and runs an MCP config before the developer can approve it, and an approved MCP entry can later be swapped for a malicious one with no second prompt. These are builder-tool CVEs, not application CVEs. They did not appear in this cohort because AxonBuild audits the shipped app rather than the editor it was written in. They still matter, because a compromised editor writes the code that gets shipped.
- CVE-2025-8217, the Amazon Q Developer extension for VS Code. Injected code shipped inside version 1.84.0 of the published extension and was removed in 1.85.0. Same category as the two above: a supply-chain compromise of the tooling, outside the audit boundary but upstream of every app the tool touches.
That is the part worth internalizing. The named platform CVEs get the headlines. The reachable criticals in the AxonBuild cohort were boring dependency upgrades that nobody had run.
Statistics by platform, and why we do not publish a per-platform failure rate
People asking this want a ranking of Lovable, Base44, Bolt.new, Replit, v0, Cursor, Claude Code, and GitHub Copilot. AxonBuild cannot give one, and the reason is the data rather than diplomacy. The third-party cohort is selected public repositories, referred to in AxonBuild’s own notes only by anonymized label, and the study did not record builder attribution consistently enough to divide by: a generator is noted for only one app in the whole cohort. There is no usable per-tool count here.
Even if there were, 26 apps is too few to split. This page already refuses to make a category claim from the three-app revenue and billing sample earlier on this page, and the same rule has to apply here. A tool with a handful of audited apps and a few criticals does not have a failure rate; it has a sample too small to have a rate at all. Pages that publish per-platform percentages from cohorts this size are reporting noise with a decimal point on it.
What the corpus does support is a statement about the stack rather than the generator. Supabase- or Lovable-style stacks are overrepresented in the selection, and the shape of the failure followed the backend: apps on a managed Postgres with Row Level Security failed in RLS-shaped ways, and apps with a hand-rolled API failed in authorization-shaped ways. The rest of the gaps are ones no generator prevents. Missing tests, missing deploy gates, missing monitoring, and missing ownership checks appeared across the whole corpus, which is why I treat them as the baseline rather than a platform trait.
Which of the 26 apps came back clean?
Four of the 26 apps had no confirmed-critical finding. They remained amber in the historical model because they still had bounded work to finish, but they were not counted as critical failures.
The held-out cohort supplies a second negative result, this one about the method rather than the apps. Across ten apps the engine had not seen during method development, no reported finding failed final verification, and recall was 1.0 against the curated ground truth. The recall claim is limited to known confirmed findings in those repositories. The study did not use a seeded-defect benchmark, so it cannot claim recall against every possible hidden defect.
I ran the same audit on my own five production apps
The corpus would mean less if the engine had only ever been pointed at strangers’ code. My own five production apps went through the identical process, and every one came back red in the historical model, with scores of 36, 43, 49, 53, and 63.
The 36 stung the most because I know exactly why it happened. That app runs live coaching sessions behind a properly wired enterprise SSO login. Underneath it sat a leftover side door: a five-digit numeric code, generated with nothing stronger than a basic random-integer call, checked with no rate limit and no lockout. Ninety thousand possible codes with no throttle between guesses was all that stood between a stranger and a full account takeover, and the codes sat in the database unhashed. The front door was the one I would point to in a sales call. The side door was the one that would have let someone in.
That finding is the one that stays with me from my own five: good work in one place buys you nothing in another. The method did not soften because the apps were mine.
How this study differs from larger scans
Larger studies answer different questions. Escape’s 5,600-app scan reported more than 2,000 vulnerabilities and more than 400 exposed secrets. Symbiotic Security’s 1,072-app study reported 26 apps without detected issues.
Those studies offer scale. This study offers code-level verification, explicit eligible denominators, negative findings, and the distinction between a scanner advisory and a reachable mechanism. The datasets and methods are different, so their percentages should not be combined or presented as replications of one another.
Limitations and update policy
The corpus was selected rather than randomly sampled. The third-party set consists of public repositories that builders shipped in the open, and the five founder-owned apps add a separate convenience sample. Web apps and Supabase- or Lovable-style stacks are overrepresented. The study includes no mobile-app audit and no platform has enough apps for a defensible platform-specific failure rate.
The collection window is June and July 2026. Product defaults and AI coding tools will change. The fixed cohort will therefore remain a dated snapshot, and new audits will be tracked in separate rolling analyses rather than retroactively changing these denominators.
Is the picture improving? This study cannot answer that. One collection window has no time axis. The studies that do have one point the wrong way. Veracode’s security pass rate for AI-generated code sits at 55%, and Veracode reports it staying flat across model generations while the same models got much better at writing code that compiles and runs. Bigger models wrote better code and no safer code. Georgia Tech’s tracker of AI-linked CVEs rose from 6 in January 2026 to 35 in March 2026. Neither result is proof that the code is getting worse, since attention and detection are both rising too. It is fair to say nothing published so far shows it getting better.
The useful conclusion is specific: in this selected set, confirmed criticals, missing tests, absent monitoring, and authorization gaps appeared often enough to justify testing those boundaries in any app with real users, data, or money attached. Whether all vibe-coded apps are safe is a verdict question with its own separate answer built on this same data. These figures cannot decide whether one unreviewed app is safe.
Common questions about vibe coding security statistics
What percentage of AI-generated code has security vulnerabilities?
Published figures run from about 40% to about 90%, and the spread is caused by different denominators rather than disagreement. Veracode found 45% of samples introduced an OWASP Top 10 flaw across 100+ models and 80+ tasks. The 2021 Copilot study found about 40% of 1,689 generated programs vulnerable, the SusVibes benchmark found only 10.5% of agent-generated patches secure, and Symbiotic Security found 98% of 1,072 live Supabase-backed apps had at least one issue. What a Copilot plan setting can and cannot see is the tool-level version of the same denominator problem.
Any single percentage you see quoted is measuring one of three different things: raw model output on a fixed task, a shipped app scanned from the outside, or a code-level audit. Always ask what the denominator was before repeating the number.
Is vibe coding safe for production apps?
Not by default, and the failure is operational as often as it is a coding flaw. In AxonBuild’s 26-app study, 22 had a confirmed critical, at least 23 had no working automated tests, and 17 of 21 third-party apps had no error tracking. A vibe-coded app can be made safe for production, but not by the tool, and not without someone checking the boundaries where money, data, and identity meet.
The verdict question gets its own answer on are vibe-coded apps safe, built on this same data. These statistics cannot decide whether one specific unreviewed app is safe.
Which vibe coding platform produces the most security issues?
No trustworthy study supports a per-platform failure rate, and AxonBuild’s own is no exception. The AxonBuild cohort is selected public repositories plus five founder-owned apps, and the study did not record which assistant built each one consistently enough to compare, so there is no per-tool denominator to report. Even with those counts, 26 apps split across the field (Lovable, Base44, Bolt.new, Replit, v0, Cursor, Claude Code, GitHub Copilot) would be far too few for a rate. The gaps the study did count are ones no generator prevents: missing tests, missing deploy gates, missing monitoring, and missing ownership checks.
Do AI coding tools leak API keys?
Less often than the headlines suggest. In the AxonBuild cohort, 6 of 21 third-party apps shipped or committed a real secret, and secrets and credentials was the strongest-scoring area at 84.4 out of 100. Most builders kept credentials in environment variables, because the platforms make that the default path. A leaked secret is severe when it happens; it is not the most common failure.
What is the most common vulnerability in AI-generated code?
Broken access control, in one form or another. Across AxonBuild’s 26 apps, 11 of 21 third-party apps had an unauthenticated endpoint doing privileged work, 10 of 21 had a server trusting a browser-supplied fact (CWE-602), and 7 of 21 had confirmed cross-user data access, the class searched as IDOR or BOLA (CWE-639). In benchmark studies of raw model output, cross-site scripting leads instead, with Veracode reporting an 86% failure rate on XSS defense.
The two results are compatible. Frameworks escape output by default, so XSS often dies before it ships. Nothing in a framework decides whether a given user is allowed to read a given row, so authorization survives to production.
What is production hardening for a vibe-coded app?
Production hardening is the set of controls that catch a failure before a customer does: a deploy gate that runs tests and dependency checks, error tracking with alerting, and rate limits on the endpoints that cost money. Those three were the widest gaps in this study: 17 of 21 third-party apps had no error tracking, at least 17 of 21 had no deploy gate, and 13 of 21 had no rate limit on their costliest endpoint. None of them require changing what the product does.
How many of the 26 apps had a critical security or readiness finding?
Twenty-two of 26 had at least one confirmed-critical finding. Four had no confirmed critical, and none reached the historical green band. These are fixed June and July 2026 cohort results, not a population-wide failure rate.
What was the most common problem in the 26 audited apps?
At least 23 of 26 apps had no working automated tests. Among the 21 third-party apps, 17 had no error tracking or alerting, and at least 17 had no deploy gate. These operational controls were missing more often than exposed credentials.
Are the figures updated when new apps are reviewed?
No. This page is a fixed historical study of 26 apps reviewed in June and July 2026. Future reviews belong in a separately dated rolling aggregate. Historical denominators stay fixed so citations to this study remain reproducible.
Cite this study
The figures on this page may be quoted with attribution. No permission request is needed.
AxonBuild. “Vibe Coded Apps Security Statistics: 26 Real Audits.” Published 18 July 2026, updated 16 August 2026. https://axonbuild.com/blog/vibe-coded-apps-security-statistics/
Individual figures are deep-linkable. The key numbers carry anchor ids (#stat-confirmed-critical, #stat-no-tests, #stat-total-findings, #stat-weakest-area, #stat-strongest-area, #stat-score-distribution, #stat-held-out-recall, #stat-founder-owned-scores), and each table carries a captioned anchor from #table-1 to #table-6 stating the denominator that table’s rows are measured over.
When quoting a number, carry its denominator with it. “12 of 14 third-party apps with an AI surface had a denial-of-wallet path” is the claim this study supports. “12 of 26” is not, and neither is any percentage derived from the wrong base. The eligible-app count for every figure is printed next to it on this page for exactly that reason.
Launching soon and want a second pair of eyes?
I check what breaks with real users and real payments, then fix it before they find it.
Talk about your app →  Free 20-minute video call with me.