Supabase can be the slow part, but a slow screen does not identify the cause. Start with scope. A regional incident points toward the platform. One slow route points toward its query or payload. Broad slowness in one project points toward project resources, connection pressure, or a dependency. Images, Realtime updates need their own diagnosis, and database queries each take a different path and need separate measurements.
That gives you a useful order of work: identify the affected Supabase product, measure where the time goes, inspect the query or connection path, and consider more compute only after the evidence points there.
Start here: the five things that are usually actually slow. Four of the five cost nothing to fix.
- Your region is far from your users. Distance is paid on every request, and AI builders pick a default region that is often on another continent.
- You are on the free plan, or the project paused. Shared Nano compute and a cold restore both look like a broken app.
- An RLS policy runs once per row. The generated
auth.uid() = user_idpolicy is re-evaluated per row until you wrap it in a select. - A query returns everything, or fires once per item. Unbounded selects and N+1 patterns stay invisible on demo data.
- It is Storage or Realtime, not the database. Different systems, different measurements.
If you have five minutes: check the status page, open the browser Network panel and find the slow request, read the project’s Query Performance report, then confirm whether your code uses the Data API or a Postgres connection string. The full seven-step order is at the end of this post.
Checks verified against Supabase’s current docs on 2026-08-05.
Is Supabase down, or is one part of your app slow?
Check Supabase’s status page for the region and product you use. A matching incident is useful evidence. A green status page only means there is no listed platform incident; it cannot rule out a new incident or a problem limited to your project.
If you arrived here from checking whether Supabase is down, or whether Supabase is slow today, and the status page is green, the question has already changed shape. The platform becomes the less likely suspect, though a green page cannot clear it of an incident that has not been posted yet, so the useful question is which part of your own stack is doing the waiting, and the rest of this post is that order of checks.
Then open the browser’s Network panel and compare a fast request with the slow one. Record the URL, status, response size, and total duration. The host and path usually tell you whether you are waiting on the Data API, an Edge Function, Storage, Realtime, or your own server.
| What you're seeing | Best first check |
|---|---|
| Several Supabase products are slow in one region | Status page and project logs before changing queries |
| One database-backed page or endpoint is slow | Query statistics, execution plan, returned rows, and payload size |
| A serverless or edge deployment slows under concurrency | Database connection mode and active connection pressure |
| Files are slow while database requests are normal | Object size, cache status, bucket privacy, and image dimensions |
In AxonBuild’s fixed June and July 2026 cohort, Performance and Scale averaged 53.3 out of 100 across 21 third-party apps. That historical score is not a Supabase outage rate and does not say how often a particular query problem occurs. It does support one narrower conclusion: performance assumptions in an AI-built app need to be measured on the app’s real paths and data volumes.
A slow query and a status-page outage produce the identical symptom in your browser tab, and only one of them is Supabase’s problem to fix.
Check the distance between your users and your Supabase region
Every request pays the round trip between your user and your project’s region. Supabase’s region guidance is one line: choose the location closest to your users for the best performance. AI builders pick a default region when they create the project, and nobody goes back to check it, so a founder in London can be running a database in Oregon without ever deciding to.
Measure it before you argue about queries. Run this against the slow request itself, with the path and query string copied from the Network panel (the bare /rest/v1/ root would only measure the connection); it splits one request into DNS, connection, TLS handshake, and server time:
curl -o /dev/null -s -w "dns %{time_namelookup}s  connect %{time_connect}s  tls %{time_appconnect}s  server %{time_starttransfer}s  total %{time_total}s\n" \
  -H "apikey: YOUR-ANON-KEY" \
  "https://YOUR-PROJECT-REF.supabase.co/rest/v1/YOUR-SLOW-PATH"
Read it like this. connect minus dns is one network round trip to your region. server minus tls is roughly the time Supabase spent producing that response, which for a table request includes the query. If connect is 200ms and server time is 30ms, the region is your problem and no index will fix it. If connect is 20ms and server time is 900ms, the time is being spent on Supabase’s side, and the Query Performance report and execution plan below tell you whether the query is the reason. This is connection and time-to-first-byte evidence, so confirm the query’s own execution time in the database before you change SQL. Run the command from a machine near your users, and also from your laptop for comparison.
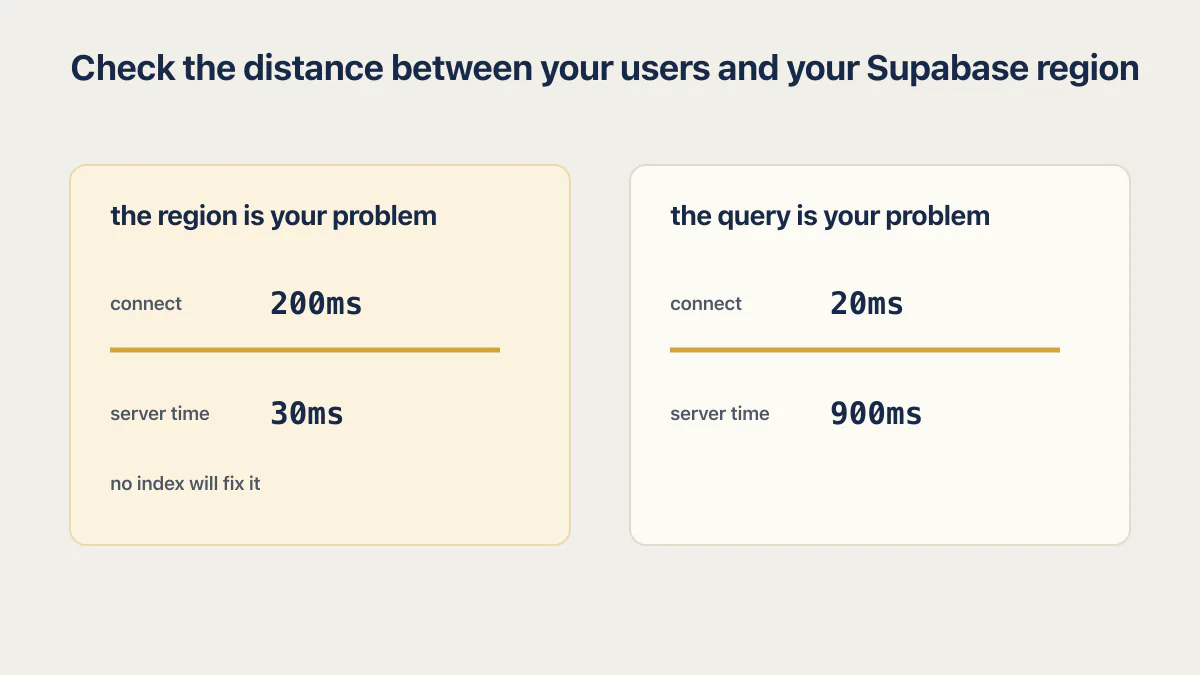
Changing region means a migration rather than a settings change: Supabase’s documented path is to create a new project in the target region and move the data across. Decide with numbers first. For read-heavy public data, caching at the edge is usually cheaper than moving the database.
There is no change-region button to look for. As of August 2026 that troubleshooting page documents no way to move an existing project between regions from project settings, so every search for how to change a region in Supabase resolves to the same two steps: stand up a new project in the region you want, migrate the data, then repoint the app at it. Treat it as a planned migration with downtime rather than a checkbox you flip while debugging.
Why Supabase feels slow on the free tier (and after a project pauses)
The free plan runs on Supabase’s smallest compute size, Nano. Response times that are slow but consistent on a free project are usually the plan rather than a bug in your code, and the same query on a larger compute size can feel like a different application.
So the Supabase free tier is slow in a specific, predictable way: less CPU, memory and disk throughput than a paid project, plus a cold first request after a pause. That is a different slowness from a missing index, where the same query keeps getting worse as the table grows. That distinction decides whether upgrading the plan is the fix or an expensive way to postpone one.
Pausing is the bigger surprise. Supabase pauses free projects that show low activity over a 7-day period. Its project pausing documentation puts the bar low: a few user requests to the database each day over the previous week is enough to keep a project from being paused. You restore a paused project from the dashboard, and Supabase documents a one-year window to do that.
Telling a cold start from a slow query takes about ten seconds:
- First request slow, everything after it fine. That is a restore or a cold connection, not your SQL.
- Every request slow, by roughly the same amount every time. That is compute size, region distance, or the query itself.
- Fast when you test it, slow for real users. That is region distance or per-user work such as an RLS policy.
New projects also take a few minutes to provision, because Supabase is standing up a real Postgres instance for you. That wait happens once and says nothing about how fast your queries will be afterwards.
What the error or warning message actually means
If you have an actual string in front of you, start here instead of with a diagnosis order.
| Message you see | What it usually means | First thing to do |
|---|---|---|
FATAL: remaining connection slots are reserved for non-replication superuser connections | Postgres has no connections left. Something is opening direct connections faster than it closes them, usually a serverless function or a job. | Query pg_stat_activity to see who is holding connections, then move short-lived code to the transaction pooler on port 6543. |
| ”Your project is currently exhausting multiple resources, and its performance is affected. Upgrade your compute or use the AI assistant to identify and optimize the most expensive queries.” | The dashboard’s resource banner. The project is saturated on memory, CPU, or disk IO. | Read the Query Performance report before you upgrade. Buying compute around one bad query is a monthly bill for a one-time fix. |
canceling statement due to statement timeout (Postgres code 57014) | The statement ran longer than the role’s timeout. Supabase’s defaults are 3s for anon and 8s for authenticated. | Run explain analyze on that statement. A timeout on a small table is almost always a missing index or a per-row policy. |
Those role defaults come from Supabase’s statement timeouts guide. Raising a timeout hides the symptom; it is worth doing only after you know why the statement is slow.
One more dashboard message does not belong in that table, because it is a warning rather than an error: the notice that your project is about to deplete its disk IO budget. That is disk throughput rather than SQL, and it has its own metric. Supabase’s compute and disk documentation says a Disk IO % consumed figure above 1 percent already means the workload went past its baseline throughput during the day, and that at 100 percent the workload has used up all available disk IO budget. Read that figure in the project’s usage reports before you treat the warning as a broken query: a batch import, a backup window or an unindexed scan over a large table can all spend the budget, and only the last one is fixed by editing SQL.
Find the slow query: Query Performance report, pg_stat_statements, and EXPLAIN
Start in the dashboard rather than in SQL. Supabase’s reports documentation describes a Query Performance report that links to the Query Performance Advisory page and analyses slow database queries for you. That is the surface most readers are actually looking for, and it needs no setup.
The pg_stat_statements extension records statistics for executed SQL statements. Supabase’s query-performance documentation explains how to enable it and compare calls, mean execution time, maximum execution time, and total execution time. A query with the largest total time may deserve attention even when each individual call looks tolerable.
For a specific query, inspect its execution plan. Supabase’s performance-debugging guide supports plans through the client, but keeps that feature disabled by default because plans can reveal database structure. Use a safe non-production environment where possible. EXPLAIN ANALYZE actually runs the statement, so do not use it casually on a write.
The plan gives you evidence for the next move: a sequential scan over a growing table, a bad row estimate, an expensive sort, repeated policy work, or a query returning far more rows than the page uses.
Three queries do most of the work. The first ranks statements by the total time they consume, which is where the real cost hides:
-- The 10 statements costing the most total time.
select
  calls,
  round(mean_exec_time::numeric, 1) as mean_ms,
  round(total_exec_time::numeric, 1) as total_ms,
  query
from pg_stat_statements
order by total_exec_time desc
limit 10;
The second asks Postgres which index would help. Supabase ships the index_advisor extension, which takes a query and returns the cost before and after, plus the create index statements it recommends in index_statements:
create extension if not exists index_advisor;

select index_statements, total_cost_before, total_cost_after
from index_advisor('select * from documents where user_id = $1');
The third shows who is holding connections right now, which is the check the connection-slots error sends you to:
-- Connection pressure, grouped by state.
select state, count(*), max(now() - state_change) as longest
from pg_stat_activity
where datname = current_database()
group by state
order by count(*) desc;
A large idle in transaction count is its own bug: something opened a transaction and never closed it.
Check connection mode only when your code opens Postgres connections
Browser calls made with supabase-js normally use the Data API. They do not open one direct Postgres connection per visitor. Connection exhaustion becomes relevant when a backend, ORM, job, or serverless function uses a Postgres connection string.
Supabase’s current database connection guide separates the Data API from four Postgres connection modes. Direct and shared session-pooler connections can both use port 5432, so the port alone does not tell you which one is configured.
| Workload | Connection route |
|---|---|
| Browser or mobile client | Data API with RLS |
| Long-lived backend on a compatible network | Direct connection or an application-side pool |
| Persistent backend that needs the shared IPv4 pooler | Shared pooler in session mode |
| Serverless or edge functions with temporary connections | Shared or dedicated transaction pooler on port 6543 |
Transaction pooling does not support prepared statements. If your driver enables them, use the driver setting Supabase documents for that connection mode. Copy the appropriate string from the project’s Connect panel rather than reconstructing it from a port number.
The ORM is rarely the slow part. Prisma and Drizzle both run fine on Supabase Postgres. What makes “do not use an ORM with Supabase” sound true is the deployment around it: a Next.js server component or route handler that opens a connection per request, a transaction pooler that does not support the prepared statements the driver wants, and a relation loader quietly issuing one query per parent row. Point the ORM at the connection string that matches the runtime, disable prepared statements where the pooler requires it, and read the SQL it generates for your heaviest route.
If concurrency is the symptom you are chasing, the connection-cliff diagnosis for an app that stalls under load covers active connections, queues, and load testing in more depth.
The foreign-key index Postgres does not add
A foreign key references columns backed by a unique or primary-key constraint, but PostgreSQL does not automatically index the referencing column. PostgreSQL’s constraint documentation leaves that choice to the schema designer.
alter table orders
  add column customer_id uuid references customers(id);

create index orders_customer_id_idx on orders (customer_id);
The index is useful only when the query pattern needs it. Confirm the slow statement and its plan before adding indexes, because every index also adds storage and write work.
Your RLS policies may be running once per row
This is the most common Supabase-specific cause of slowness in AI-generated apps. The policy below looks correct, and it is correct. It is also slow:
-- What AI tools usually generate.
create policy "Users read their own rows"
on documents for select
using ( auth.uid() = user_id );
Written that way, Postgres calls auth.uid() for every row it considers. On a few hundred rows nobody notices. On a few hundred thousand, the page hangs and the query eventually hits the role’s statement timeout.
Two changes fix it. Postgres refuses a second policy with the same name on the same table, so the first statement replaces the one above; run the drop and the create in one transaction so the table is never left without the policy:
-- 1. Replace the policy so the call is evaluated once per statement.
drop policy "Users read their own rows" on documents;
create policy "Users read their own rows"
on documents for select
to authenticated
using ( (select auth.uid()) = user_id );

-- 2. Index the column the policy filters on.
create index documents_user_id_idx on documents (user_id);
Wrapping the call in a select lets the planner run it as an initPlan and cache the result for the whole statement rather than per row. Supabase’s RLS performance guidance documents both changes and reports the numbers from its own tests: wrapping the call cut a query from 179ms to 9ms (94.97 percent), and adding the index cut one from 171ms to under 0.1ms (99.94 percent).
You can see the difference in the plan. Before, the identity check sits in a per-row filter over a full scan:
Seq Scan on documents
  Filter: (auth.uid() = user_id)
After, the identity is computed once and the scan becomes an index lookup:
Index Scan using documents_user_id_idx on documents
  Index Cond: (user_id = $0)
  InitPlan 1 (returns $0)
    ->  Result
Two more habits from the same guidance. Add to authenticated (or whichever role applies) so the policy is never evaluated for roles that could not pass it. And keep the matching filter in your query, .eq("user_id", userId), instead of leaving the policy to do the filtering: the policy is a guarantee rather than a query plan.
Check every table an AI tool generated policies for, not just the slow one. They tend to be written from the same template.
Bound the rows and round trips
An unbounded select can return every matching row and column when the page needs only a few. An N+1 fetches a list once, then fetches one related row per item in it. Ten items then require eleven requests. Both problems can stay invisible in a demo account and grow with real data.
One app in the fixed audit cohort was a Supabase-backed golf analytics tool. Its stats page fetched the user’s full shot history without a limit, aggregated it in the browser, and bundled a 434 KB demo dataset for every visitor. This is one app-level example rather than a finding about Supabase itself.
// Returns every column from every matching row.
const { data } = await supabase.from("shots")
  .select("*").eq("user_id", userId);

// Returns the columns and row count this screen needs.
const { data } = await supabase
  .from("shots")
  .select("club, distance, created_at")
  .eq("user_id", userId)
  .order("created_at", { ascending: false })
  .limit(50);
Read the SQL your ORM generates for relation-heavy pages. A convenient relation loader can still produce repeated queries, and the database statistics will show the call count even when application code makes the operation look singular.
Slow inserts and bulk data loads
Everything above is the read path. Writes fail differently, and the usual cause is one HTTP request per row.
// 500 rows, 500 round trips, 500 policy evaluations.
for (const row of rows) {
  await supabase.from("events").insert(row);
}

// One request, one statement.
await supabase.from("events").insert(rows);
This shows up most often with automation tools. n8n, Make, and Zapier iterate over items by default, so a workflow that “inserts 5,000 rows” is really making 5,000 API calls, each paying the full network round trip to your region. Collect the items into an array and insert a chunk at a time. Start at a few hundred rows per request, then increase the chunk until the request time stops improving or you approach the statement timeout.
Three other things make writes expensive:
- Triggers. A trigger that writes an audit row or recalculates a total runs once per inserted row. A bulk load multiplies it.
- Indexes. Every index is extra write work. The index that fixed your read path is a tax on your import job.
- Connection mode. A batch job is not a browser client. Give it a Postgres connection string with the pooler mode that matches how long it lives, and do not fan it out into hundreds of parallel connections.
For a one-time migration of a large file, copy over a direct Postgres connection beats any loop through the API.
What more compute can and cannot change
More CPU, memory, and database connections can help a project that is genuinely resource-constrained. They can also make a table scan finish sooner. They do not change the way that scan grows as the table grows, remove excess round trips, or reduce a response that returns thousands of unused rows.
Supabase’s compute guidance recommends deciding whether the bottleneck is hardware- or software-constrained. Compare CPU, memory, disk I/O, connection pressure, and query latency during a reproducible load test. Upgrade when those measurements stay saturated after the obvious query and connection problems are addressed. What each compute size costs, tier by tier, is priced out separately.
Two measurements deserve their own names, because both look like a broken query and neither is one.
Disk IO Budget. Smaller compute sizes get a burst of disk throughput on top of a baseline rate. Once the burst capacity is exhausted, performance returns to baseline, so the query that ran fine this morning crawls this afternoon with nothing in your code changed. The dashboard metric is “Disk IO % consumed”, and at 100 percent the workload has used all of its available disk IO budget. CPU usually rises at the same time because the instance is waiting on IO, and background work such as autovacuum and backups is competing for the same disk.
Cache hit rate. Postgres serves what fits in memory. Once a table’s indexes are too large to stay cached, reads that used to be memory lookups become disk reads, and queries that sat comfortably under 100ms fall off a cliff at no particular threshold you were warned about. This is the one failure mode where sizing up is the right answer rather than an expensive way to avoid fixing a query.
If the measurements show a tradeoff rather than a broken query, the reasons teams choose Supabase and the limits they accept provide the platform-level context. If they still point toward a platform mismatch, compare Supabase alternatives against the workload you actually have before migrating the same query shape elsewhere.
When it is the Supabase dashboard that is slow, not your app
Studio taking minutes to load is a different problem from your app being slow, and a common one. Establish which you have before debugging the wrong system: while the dashboard spins, hit your own API endpoint with the curl command from the region section. If the API answers quickly and Studio does not, the slowness is specific to what Studio is doing: usually a heavy dashboard view over a large table, or a project saturated on a resource that one small indexed call never touches, and the usage reports settle which. If both crawl, the project itself is saturated.
The dashboard reads your project like any other client, and its queries run as the postgres role. A project pinned at 100 percent memory, CPU, or Disk IO will make Studio unusable while a small indexed API call still returns in milliseconds. Open the project’s usage reports and check memory, CPU, and Disk IO before assuming Supabase’s UI is broken. Table and log views over very large tables are also slow by nature, so filter before you browse.
A Supabase dashboard that is very slow while your own API answers in milliseconds usually points at the project’s resources or at the view you opened rather than at a broken UI, and refreshing Studio does not move it; the usage reports and the size of the table behind the view are the evidence that separates the two. Studio is also a client on the network, so it pays the same round trip to your project’s region that the curl check above measures: a distant region shows up in both places, and only one of them is worth migrating for.
Diagnose Storage and Realtime separately
Supabase Storage uses a CDN, and the response’s cf-cache-status header tells you whether a request was a HIT or MISS. The Storage CDN documentation explains that the first regional request may reach the origin and that private-bucket permissions are checked per user, reducing cache reuse between users. Bucket privacy should follow the data’s access requirements, even when a public bucket would cache more efficiently.
Also compare the file’s byte size with the dimensions the page renders. Supabase image transformations can resize an asset at delivery time, but hosted image transformation is a paid-plan feature and has its own usage model. Pre-generating common sizes is another option.
Realtime
Realtime is a separate service with its own cost, so count each layer before blaming the database. A list of 30 rows can mount 30 channels, but those channels may share one client WebSocket connection. Count client connections, channels joined per connection, Postgres Changes subscriptions, messages, and per-subscriber authorization work separately. Then consolidate component-level subscriptions when the measurements show duplicated work.
Check what you are listening to as well. A subscription to every change on a busy table sends the client traffic it will immediately discard, so filter the subscription to the rows the screen actually shows. When updates only need to be seconds-fresh, refetching on an interval is simpler, cheaper, and far easier to debug than a live channel. The project’s Realtime report shows connection and message volume when you need evidence rather than a hunch.
Database, Storage, and Realtime symptoms can look identical in a spinner. The request URL, server timing, query statistics, returned bytes, and cache status separate them.
A practical diagnosis order
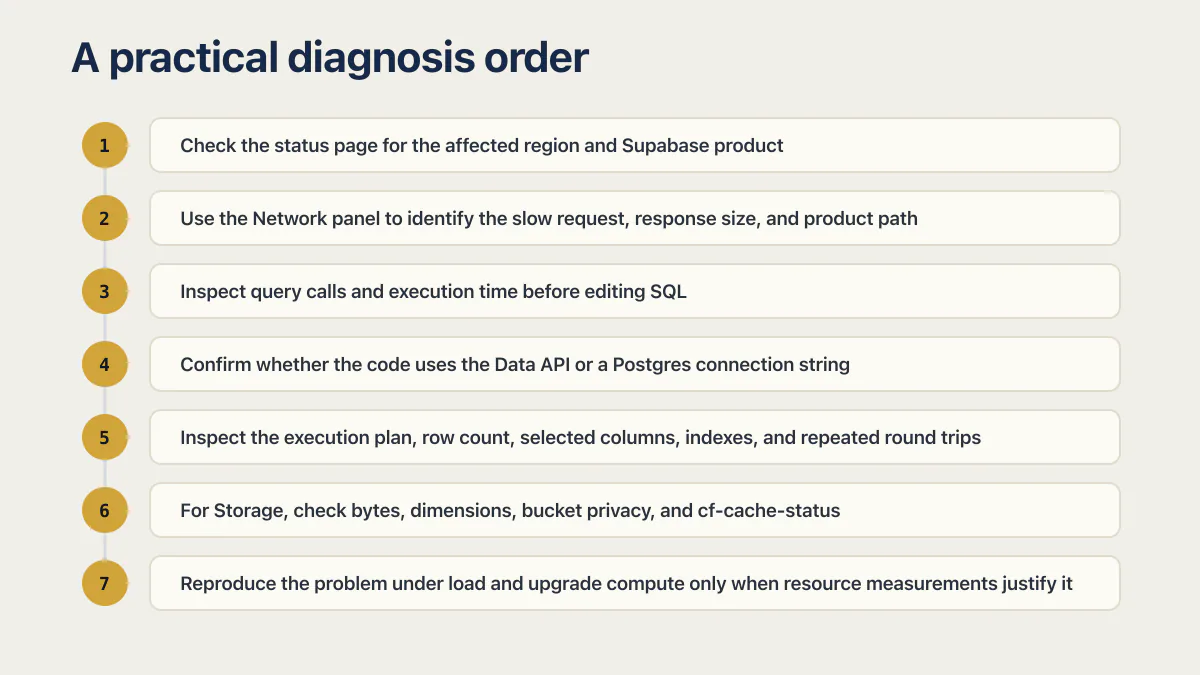
- 01 Check the status page for the affected region and Supabase product
- 02 Use the Network panel to identify the slow request, response size, and product path
- 03 For database work, inspect query calls and execution time before editing SQL
- 04 Confirm whether the code uses the Data API or a Postgres connection string, then verify the connection mode
- 05 Inspect the execution plan, row count, selected columns, indexes, and repeated round trips
- 06 For Storage, check bytes, dimensions, bucket privacy, and cf-cache-status
- 07 Reproduce the problem under load and upgrade compute only when resource measurements justify it
Common questions about Supabase performance
Is Supabase down right now?
Check the status page for your region and affected product. A matching incident supports a platform diagnosis. A green page does not rule out a project-specific problem or an incident that has not been posted yet.
Why is the Supabase free tier so slow?
The free plan runs on Supabase’s smallest compute size, Nano, so a free project has less CPU, memory, and disk throughput than a paid one. Supabase also pauses free projects that show low activity over a 7-day period, and the first request after a restore is slow while everything after it is normal. If every request is slow by a similar amount, that points to the plan, the region, or the query itself, so measure the round trip and the query before upgrading; if only the first one is, that is a cold start.
Why does creating a Supabase project take about 2 minutes?
Creating a project provisions a real Postgres database rather than a row in a shared table, so a wait at creation is normal. It happens once and tells you nothing about how fast your queries will be afterwards. If requests are still slow once the project is up, measure the region round trip and the query separately.
Does my Supabase region affect speed?
Yes, and it is the most common cause people miss. Every request pays the network round trip between your user and the project’s region, and an AI builder picks a default region that may be on another continent from your users. Measure it with a curl timing command run from a machine near your users: if the connect time dwarfs the server time, distance is your bottleneck and no index will help.
Why is the Supabase dashboard slow?
Studio is a client of your project, so a project saturated on memory, CPU, or Disk IO makes the dashboard crawl even while your API still answers quickly. Check the usage reports for those three metrics before assuming Supabase’s UI is broken. Very large tables also make the table and log views slow to browse, so filter instead of scrolling.
Does Realtime slow down my database?
Realtime can add load, but a channel is not the same as a WebSocket connection. One client connection can join multiple channels, up to 100 on current standard plans. Check the Realtime report for client connections, channel joins, Postgres Changes subscriptions, messages, and authorization work before choosing a fix. Consolidate duplicated component-level subscriptions when they add unnecessary channels or work. When data only needs to be seconds-fresh, refetching on an interval is cheaper and easier to debug.
Why do my bulk inserts take so long?
Almost always because something is sending one HTTP request per row. Automation tools such as n8n, Make, and Zapier iterate over items by default, so 5,000 rows become 5,000 API calls, each paying the full round trip to your region. Insert an array of rows in one call, chunk large loads into batches, and check whether triggers or extra indexes are making each write expensive.
Do I need to upgrade my Supabase plan to fix slow queries?
Upgrade after measurements show sustained resource pressure. A larger compute size may reduce runtime, but it does not repair an unbounded query, repeated round trips, or an unsuitable connection mode.
Should I use an ORM with Supabase?
An ORM can work with Supabase Postgres. Match its driver and connection behavior to the deployment: long-lived services and temporary serverless functions have different pooling needs, and transaction mode may require prepared statements to be disabled. Inspect generated SQL for relation-heavy routes.
What should I check first when one page is slow?
Find its slowest network request, then inspect the system that served that request. For a database route, compare query count, execution time, returned rows, and payload size before changing compute or schema.
Built it with AI. Can’t get the last part right?
That’s the normal state of an AI-built app, and it’s fixable. I trace what the app actually does, explain what needs changing, and build it if you want me to.
Talk about your app →  Free 20-minute video call with me.