Egress is every byte your project sends to a client, summed across the database, Storage, Auth, Realtime, Edge Functions, the shared pooler, and log drains. Free organizations get 10 GB of transfer per billing cycle, 5 GB uncached plus 5 GB cached. Cross it on Free and you get a billing email and a grace period, then restrictions. Nothing is deleted. First move: open your organization’s usage page and hover a date to see the per-service split.
What counts as egress in Supabase?
Egress is every byte a Supabase project sends to a connected client, summed across seven service categories: the database, Storage, Auth, Realtime, Edge Functions, shared pooler, and log drains. That sum is the part most people typing “supabase egress exceeded” into a search box haven’t found yet. Supabase uses “bandwidth” and “egress” for the same meter, so a chatty Realtime subscription counts against the same number as a video download.
Verified against Supabase’s current egress documentation on 2026-08-06:
| Plan | Included egress | Included cached egress | Overage, uncached | Overage, cached |
|---|---|---|---|---|
| Free | 5 GB | 5 GB | not available | not available |
| Pro | 250 GB | 250 GB | $0.09/GB | $0.03/GB |
| Team | 250 GB | 250 GB | $0.09/GB | $0.03/GB |
Free totals 10 GB of transfer, 5 GB uncached plus 5 GB cached. That is the phrasing Supabase’s own bandwidth doc uses, and the one most people arrive holding.
Usage is metered at the organization level, so every project in the organization draws from the same quota. Cached and uncached usage are billed independently, and both are counted when a byte leaves the project, whichever service sent it.
What happens when you hit the Supabase egress limit on the Free plan
Nothing is deleted, and nothing happens the instant the bar turns red. The sequence:
- You cross the quota. Supabase sends a notification to the organization’s billing email address and puts the organization under a grace period.
- Usage keeps running. If it stays over, the Fair Use policy applies. Restrictions can include pausing projects, switching the database to read-only, blocking new project launches or transfers, and answering API requests with a 402 status.
- Your data stays put. A restriction blocks or narrows access. It does not delete rows, buckets, or the project.
- It clears on its own. Restrictions caused by usage lift when the quota refills at the start of the next billing cycle.
- Or you clear it sooner. Upgrading a Free organization to Pro, or disabling Spend Cap on a paid organization, lifts the restriction immediately.
Two details catch people out. The dashboard keeps showing the warning after usage drops back under the line, because a second overage can bring restrictions without a second grace period. And the reset follows your billing cycle, not the first of the calendar month.
Spend Cap is the switch that decides whether an overage costs you money or costs you access. On a paid organization with Spend Cap disabled, or on Team and above, you are never restricted for egress: you pay the overage, $0.09 per GB uncached and $0.03 per GB cached. With Spend Cap enabled you stay inside the quota and take the notification-and-grace path instead. Neither setting changes how many bytes your code sends.
How to find which service is burning your egress
Start with the meter. The organization’s usage page charts egress by date, and hovering a date shows the split by service, cached traffic included. Do that before touching code: the service name tells you which row of the table below you are in.
| Service | Dashboard label | Typical culprit | Where to look |
|---|---|---|---|
| Database (PostgREST) | Database Egress | Unbounded select('*'), N+1 loops, writes returning the full row | Query Performance report |
| Shared pooler (Supavisor) | Shared Pooler Egress | Direct SQL clients, ORM defaults, manual pg_dump backups | Query Performance report, plus your backup scripts |
| Storage | Storage Egress | Full-resolution images, video, public demo assets | Logs Explorer, Storage Egress Requests template |
| Auth | Auth Egress | High-frequency token refresh and session calls | Usage page hover, then Logs Explorer |
| Edge Functions | Edge Functions Egress | Large JSON responses on every invocation | Usage page hover, then function logs |
| Realtime | Realtime Egress | Broad subscriptions pushing every row change | Usage page hover, then your subscription setup |
| Log drains | Log Drain Egress | Verbose logs shipped to a third-party destination | Your log drain configuration |
| CDN cache hits | Cached Egress | The same public asset fetched over and over | Usage page, cached line |
The two labels that confuse people are on the first two rows. Traffic from the PostgREST data API is labeled Database Egress, and traffic through Supavisor is labeled Shared Pooler Egress, so a nightly pg_dump lands under a different label than your app’s queries.
For Storage, Supabase publishes a Logs Explorer query that ranks requested files by hit count and cache status. Paste it into Logs Explorer:
select
  request.method as http_verb,
  request.path as filepath,
  (responseHeaders.cf_cache_status = 'HIT') as cached,
  count(*) as num_requests
from
  edge_logs
  cross join unnest(metadata) as metadata
  cross join unnest(metadata.request) as request
  cross join unnest(metadata.response) as response
  cross join unnest(response.headers) as responseHeaders
where
  (path like '%storage/v1/object/%' or path like '%storage/v1/render/%')
  and request.method = 'GET'
group by 1, 2, 3
order by num_requests desc
limit 100;
That gives you file paths and request counts but not bytes. Get the byte size of any one file with a single request, then multiply:
curl -s -w "%{size_download}\n" -o /dev/null \
  "https://<project>.supabase.co/storage/v1/object/<bucket>/<file>"
For database egress, the Query Performance view lists frequent queries with their average returned rows, which is usually enough to spot the uncapped select. Logs Explorer’s top-paths view shows commonly requested API paths, although Supabase currently notes those path logs do not include response-byte counts.
Why can’t the bill tell you which query caused it?
The egress meter records bytes, so the bill cannot identify the code path that produced them. An unbounded query, an oversized image, a repeatedly regenerated signed URL, and a chatty Realtime subscription can all raise the same line. Each can also make the app feel slow because the client still has to receive and process the transferred data.
The 21 third-party apps AxonBuild audited between June and July 2026 averaged 53.3 out of 100 on Performance & Scale, and each recurring finding behind that score lived in the app’s own schema and query layer, not in Supabase’s infrastructure. An unbounded query, an unresized image, a missing cache header, a demo dataset fetched by strangers: none of those are Supabase’s fault, and all four run up the same meter that also makes the page feel slow, because a byte fetched unnecessarily gets billed whether the symptom you notice is a spinner or an invoice.
The slow page and the surprise egress bill are two invoices for the same schema mistake.
Six common causes of runaway egress
- 01 An unbounded select('*') with no column list and no limit, fetching every row and every column a table has, on every request that touches it.
- 02 Full-resolution, unresized images served straight to a phone screen instead of a transform endpoint sized to what the layout actually renders.
- 03 Private files served through a newly generated signed URL on every request, which prevents later requests from reusing the same Smart CDN cache entry.
- 04 A chatty Realtime subscription, public demo dataset, or log drain sending bytes that the reader never associated with Storage egress.
- 05 A polling loop: a setInterval or a repeating useEffect that refetches the same rows every few seconds, where a Realtime subscription or a much longer interval would do. This one is about request frequency, not payload size.
- 06 Inserts and updates that return the written row by default, plus ORM defaults (Prisma, Drizzle) that select every column. Supabase names both: configure the query or the ORM not to return the whole row when you do not need it.
Each looks like an ordinary shortcut, and each carries a direct, per-request byte cost a ten-row demo account is unlikely to expose. Scaffolds from Lovable, Bolt, Base44, Replit, Cursor and Claude Code ship most of these by default, because the generated code is written against a ten-row demo dataset where none of them cost anything.
One of the audited apps, a golf-shot analytics tool built on Supabase, made this mistake twice in the same build. Its stats page ran select('*') against the shots table with no limit, so a player who had logged tens of thousands of shots re-downloaded every one of them each time the page opened, and the browser then boiled all of it down to a handful of averages. Separately, the app pushed a 434 KB demo dataset to every visitor who landed on it, signed in or not. Row-level security on that table was correctly enforced, for the record. The bytes billed anyway.
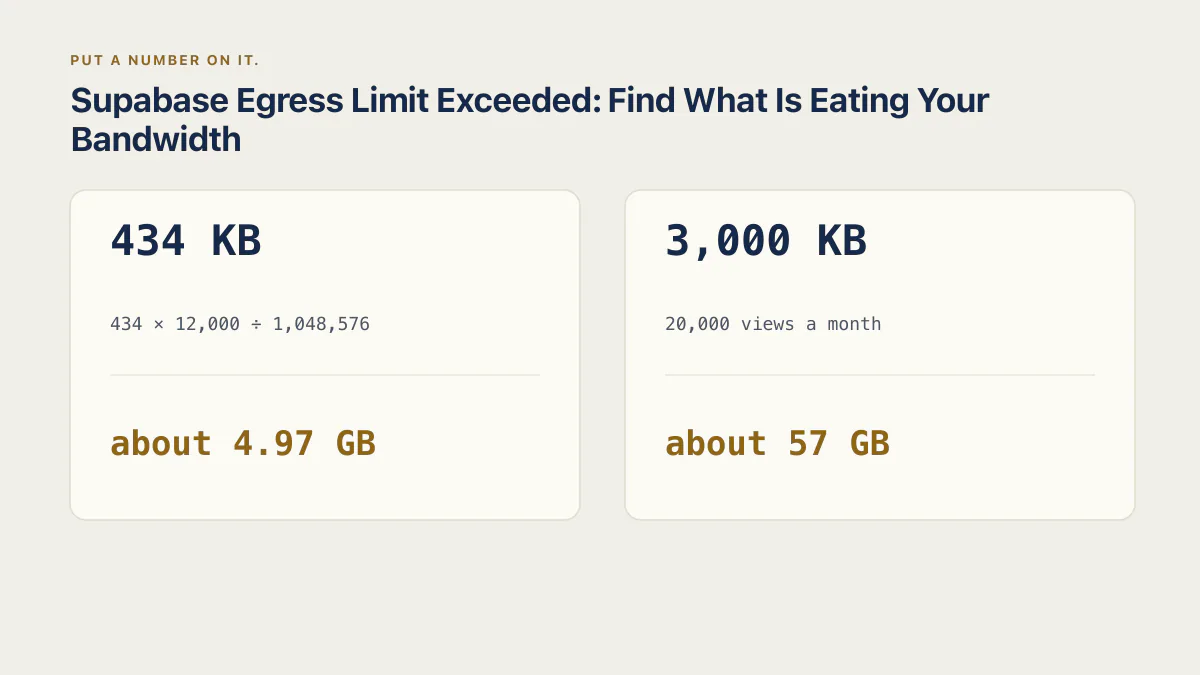
Put a number on it. 434 KB served to 12,000 visitors is 434 × 12,000 ÷ 1,048,576, or about 4.97 GB. That is the entire Free uncached quota gone on one payload nobody priced, or about $0.45 of Pro uncached overage at $0.09 per GB. The general form, for your own numbers:
payload KB × requests per cycle ÷ 1,048,576 = GB of egress
Run it once per suspicious asset. A hero image of 3,000 KB on a page that gets 20,000 views a month is about 57 GB. That uses nearly a quarter of Pro’s included 250 GB of uncached egress. It exceeds the entire Free uncached quota by more than eleven times. It creates a Pro overage only when the organization’s total uncached egress passes 250 GB in that billing cycle.
// Every column, every row, on every call. Fine for ten rows
// in a demo account.
const { data } = await supabase.from('shots')
  .select('*').eq('user_id', userId);

// Ask for what the page renders, with a limit. This is the first page;
// later pages add a cursor condition such as .lt('created_at', lastSeen).
// Fewer bytes, every time.
const { data } = await supabase
  .from('shots')
  .select('club, distance, created_at')
  .eq('user_id', userId)
  .order('created_at', { ascending: false })
  .limit(50);
Three columns and fifty rows, chosen deliberately, instead of every column and every row a user has ever logged, fetched by default. The gap between those two queries is the gap the egress line on the invoice is measuring.
The other half of the same problem is request count. A loop that looks up one row at a time sends the same rows as a single batched call, wrapped in twenty times the response overhead:
// 20 round trips, 20 response envelopes, one row each.
for (const id of ids) {
  const { data } = await supabase.from('clubs')
    .select('name').eq('id', id).single();
}

// One request, the same 20 rows.
const { data } = await supabase.from('clubs')
  .select('name').in('id', ids);
The row count is identical. The request overhead is not. This is the N+1 query problem showing up on the bill instead of the stopwatch.
What is the difference between cached and uncached egress?
Cached egress bills at a third of the uncached rate, and the two quotas are tracked separately. Supabase’s CDN documentation explains why private buckets usually have lower cross-user cache reuse: access is checked per user, so two users requesting the same private object can both produce misses while the second request for a public object in the same region can be a hit.
On Pro and higher plans, Smart CDN also caches signed URL responses. Each distinct signed token creates its own cache entry, so generating a new signed URL on every request keeps producing first-request misses. Reusing the same unexpired signed URL where the access model permits it allows later requests to hit that entry. The object’s privacy requirement still comes first. Public marketing media can use a public bucket; customer documents should not be exposed merely to improve cache reuse.
Supabase’s Smart CDN guidance also separates two controls that are easy to confuse. Smart CDN decides edge caching and revalidation. The cacheControl value supplied at upload controls how long the browser stores the response. For the layers beyond Storage, caching strategies web applications can use safely covers what to cache, how to invalidate it, and how to keep customers apart.
How do you reduce Supabase egress for good?
Fix the pattern, not the instance. Fixing the query a profiler happens to flag fixes that query’s egress, but similar uncapped selects, oversized files, signed-URL churn, polling loops, and unnecessary subscriptions can remain elsewhere. The systematic pass:
- Add a column list and a
limitto every query, and page with a cursor once a table can plausibly grow past a few hundred rows. - Replace one-row-at-a-time loops with a single
.in()call, and replace repeating refetch timers with a Realtime subscription or a much longer interval. - Serve images through Supabase’s transformation endpoint, sized to the layout, not the upload.
- Set an appropriate browser cache duration on Storage objects, and stop generating a fresh signed URL for every request when the same unexpired URL can be reused safely.
- Tell your writes and your ORM to stop returning the full row when you only needed the id.
- Gate any demo or seed dataset behind an explicit request or a signed-in session, so a visitor who never signs up never fetches it.
- Review Realtime subscriptions, log drains, and manual backups for high-frequency payloads the recipient does not need.
The image fix is one extra argument on a call you already make, and it is usually the largest single win, because images make up most of Storage egress:
const { data } = supabase.storage
  .from('avatars')
  .getPublicUrl('shot.jpg', {
    transform: { width: 400, quality: 60 },
  });
Check the linked page for whether your plan includes image transformations before you lean on this; if it does not, the equivalent is to resize the image before upload. A 3 MB upload rendered into a 400 px slot ships bytes the browser throws away on downscale. Quality defaults to 80 when you do not set it, and accepts 20 to 100. The image optimization checklist for websites covers the other image checks: dimensions, formats, compression and delivery.
| A bigger plan buys you | What it never fixes |
|---|---|
| A higher included-egress quota before overage charges start | An unbounded select('*') that still ships every row to every caller |
| More headroom for necessary private-file transfers | A new signed URL generated for every request, preventing cache-entry reuse |
| More headroom before the bill notices a mistake | The mistake itself, which runs at the identical byte cost on any tier |
Upgrading a plan buys headroom. These transfer patterns still send the same number of bytes on Free or on Team.
The same schema pass has a latency half and a cost half. Why your Supabase queries are slow covers the version of this pattern you notice as a spinner rather than an invoice, and Lovable credit costs covers the same runaway-usage story priced in prompts instead of gigabytes.
If the timing tracks a real growth curve rather than a slow leak, why your AI app stalls at 100 concurrent users covers the connection-cliff version of the same threshold. A database connection pool that runs out under load is the sharpest version of that cliff.
Common questions about Supabase egress
Is Supabase bandwidth the same thing as egress?
Yes. Supabase’s docs use both words for one meter: every byte the project sends out to a connected client. The Free Plan limit of 10 GB of bandwidth is 5 GB uncached plus 5 GB cached, and it sums traffic from the database, Storage, Auth, Realtime, Edge Functions, the shared pooler, and log drains. That is why a chatty subscription can spike the number as easily as a large file.
Why did my Supabase egress spike?
Start with the usage breakdown because database, Storage, Auth, Realtime, Edge Functions, shared-pooler traffic, and log drains all contribute. Common causes include a query returning excess rows or columns, oversized files, low cache reuse for private signed URLs, polling loops that refetch the same rows, and high-frequency Realtime or logging payloads.
Does exceeding the egress limit pause or delete my Supabase project?
Nothing is deleted. You first get a notification to the organization’s billing email and a grace period. If usage stays over the quota, Supabase’s Fair Use policy can restrict the organization: pausing projects, switching the database to read-only, blocking new project launches, and answering API requests with a 402. The restriction lifts when the quota refills at the next billing cycle, or immediately if you upgrade or disable Spend Cap. If your writes start failing in the meantime, cannot execute INSERT in a read-only transaction covers what put the database in read-only mode and how to get writes back.
Do file uploads count toward Supabase egress?
No. Supabase charges egress for network data transmitted out of the system to a connected client, so bytes you push up into Storage are not what the meter reads. What counts is every later download or view of that file. A 40 MB video costs nothing to upload and costs egress every single time somebody plays it.
When does Supabase egress reset?
At the start of your next billing cycle, not on the first of the calendar month. The quota refills then, and any restriction caused by exceeding it lifts at the same moment. On a paid organization you can clear a restriction sooner by upgrading or by disabling Spend Cap.
Why is my cached egress higher than my uncached egress?
Because most of your traffic is repeat requests for the same public objects, which the CDN serves from an edge cache instead of the origin. That is the cheaper meter: cached overage runs $0.03 per GB against $0.09 uncached. High cached egress usually means large public assets fetched over and over, so the fix is smaller files and longer browser cache durations, not privacy changes.
How do I reduce Supabase egress?
Add a column list and limit to unbounded queries, batch one-row-at-a-time loops into a single .in() call, serve images at the rendered dimensions, set an appropriate browser cache duration, and avoid generating a fresh signed URL on every request when safe reuse is possible. Keep private data private, then reduce polling, Realtime, log-drain, and API payloads that the recipient does not need.
What’s the Supabase free tier egress limit?
10 GB of transfer per billing cycle: 5 GB of uncached egress plus 5 GB of cached egress, per organization, verified against Supabase’s egress documentation on 2026-08-06. Pro includes 250 GB of each, with uncached overage at $0.09 per GB and cached overage at $0.03 per GB. What egress costs on each plan, next to the other meters on the bill, is priced out separately.
If you have a working app built with these tools and need it ready for real customers, this is what we do.
Built it with AI. Now it has to hold up for real customers.
The Production Hardening Sprint takes the app you already have and builds the production foundation underneath it. Authentication and access rules, payments that stay consistent, error handling, monitoring, backups, automated tests and a documented handover. Our engineers work inside your existing codebase for ten working days. All 123 deliverables are included, and you get the evidence for each one.
See the Production Hardening Sprint →  $2,500 fixed price · 10 working days · One codebase