A database connection pool is exhausted when every available connection is busy or unavailable and another query cannot obtain one before its timeout. Traffic bursts can cause it, but so can a leak, a slow query, a long transaction, or too many application instances each creating their own pool.
The error text identifies the layer that refused the work. PostgreSQL, an application-side pool such as Prisma or pg, and a server-side pooler such as Supavisor have separate limits. Raising the wrong limit can make the database less stable without repairing the cause.
This page covers PostgreSQL with Node, Prisma, and Supabase, including apps generated by Lovable, Bolt, Base44, Replit, Cursor, or Claude Code. The same failure in Java HikariCP, .NET Npgsql, or Python SQLAlchemy has the same shape but different settings.
Which error do you have?
- remaining connection slots are reserved for non-replication superuser connections: PostgreSQL refused you because the last emergency slots are held back.
- sorry, too many clients already: PostgreSQL is at its ceiling with no reserve available to you.
- Timed out fetching a new connection from the connection pool (Prisma P2024): Prisma’s own pool ran out of slots or out of time.
- Connection terminated due to connection timeout (node-postgres): a
pgpool checkout waited longer than its configured timeout. - Max client connections reached (Supavisor): Supabase’s pooler, not PostgreSQL, refused the client.
Stop the outage first
If the app is down right now, start here. This section buys minutes. It does not fix anything.
Idle transactions are the safest thing to clear, because no statement is running inside them, though terminating one rolls back whatever that transaction had written and not yet committed. Find them before you touch them:
select
  pid,
  usename,
  application_name,
  now() - state_change as idle_for,
  left(query, 60) as last_query
from pg_stat_activity
where datname = current_database()
  and state = 'idle in transaction'
  and now() - state_change > interval '5 minutes'
order by idle_for desc;
Read that list first. Pick out the process ids that belong to your application (usename and application_name tell you) and have sat idle for minutes, then terminate only those, by id:
select pid, pg_terminate_backend(pid)
from pg_stat_activity
where pid in (12345, 12346) -- the ids you reviewed in the list above
  and datname = current_database()
  and state = 'idle in transaction';
pg_terminate_backend(pid) terminates the session behind that process id and returns whether the signal was sent, per the PostgreSQL administration function reference. Two warnings before you run it:
- Never terminate
state = 'active'sessions blindly. Those are running queries, including migrations, backups, and someone’s checkout, and killing them rolls back real work. - This buys minutes only. The slots refill as soon as the same code path runs again.
“I already restarted the app and it came back.” Restarting the application closes its client sockets, but the PostgreSQL backends on the other side are not freed the moment you redeploy. A backend still executing a statement keeps its slot until that statement finishes or the session is terminated, so a restart can look like a fix while the ceiling is still full and refilling. Treat a restart that worked as a timer, not a repair.
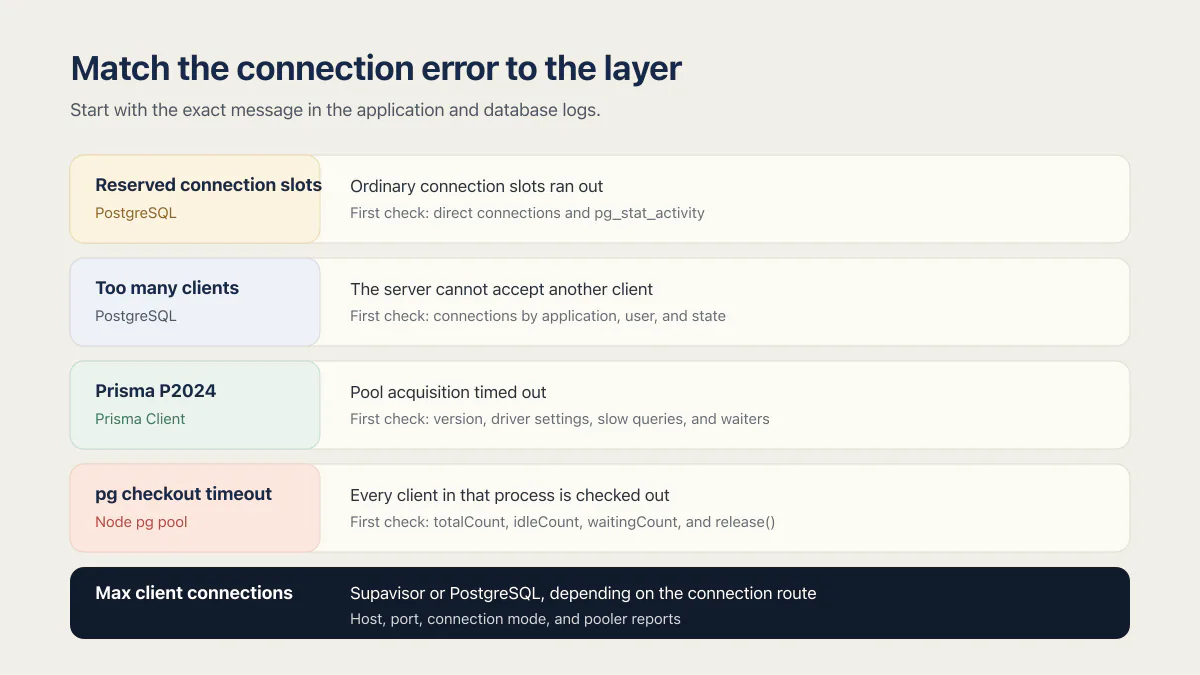
Match the error to the layer that produced it
Start with the exact message in the application and database logs. If the log instead says the database refused a write, cannot execute INSERT in a read-only transaction covers what put it in read-only mode and how to get writes back. If it shows Linux ending the process after it ran out of memory, the page on reading an OOM kill covers the log line, exit code 137, and what to change so it stops.
| Error | Layer | What ran out | First check |
|---|---|---|---|
| Reserved connection slots | PostgreSQL | Ordinary connection slots below max_connections; the reserved emergency slots remain | Direct database connections and pg_stat_activity |
| Too many clients | PostgreSQL | The server cannot accept another ordinary client | Active connections by application, user, and state |
Prisma P2024 | Prisma Client or its configured driver adapter | A query waited longer than the configured pool-acquisition timeout | Prisma version, driver settings, slow queries, waiters, and total pool capacity across instances |
pg checkout timeout | Node pg application pool | Every client in that process is checked out | totalCount, idleCount, waitingCount, and missing release() calls |
| Max client connections | Supavisor or PostgreSQL, depending on the connection route | The pooler’s client limit, the session pool size, or PostgreSQL’s direct limit | Host, port, connection mode, and the dashboard’s pooler reports |
Prisma’s timeout needs one extra version check. In Prisma ORM v6, the Rust query engine owns the pool and the connection URL controls connection_limit and pool_timeout. In Prisma ORM v7, relational databases use driver adapters by default, so the Node driver owns those settings. Prisma’s current connection-pool table lists max: 10 as the default for the pg adapter and connectionTimeoutMillis: 0, meaning no acquire timeout. A v6 URL tweak does not configure a v7 pg adapter.
Every connection-pool error in this post is the same event at a different layer: all the slots checked out, and one more request with nowhere to go.
What each connection error actually means
remaining connection slots are reserved for non-replication superuser connections
PostgreSQL caps concurrent sessions with max_connections, documented as typically 100 by default on a self-managed server, though every managed platform sets its own. On top of that cap it holds slots back: superuser_reserved_connections defaults to 3, and reserved_connections defaults to 0. Once active connections reach max_connections minus those reserves, new connections are accepted only for superusers.
That is the part that reads as nonsense during an outage. The server refuses you while slots still exist, because those last slots are deliberately kept free so an administrator can still log in and fix the problem. The error means the database is full enough that only a superuser gets the remaining slots.
On Supabase the ceiling comes from your compute size rather than from a value you set, and this error is the documented symptom of reaching it.
sorry, too many clients already
Same ceiling, and this time there is no reserve standing between you and it. PostgreSQL cannot accept another ordinary client at all. In practice the two messages point at the same investigation: count the current connections by application and by state, and find out which process is opening more of them than you expected.
The usual answer for an AI-built app is one connection string being used by a backend, a background job, a migration tool, and a handful of serverless instances at the same time, none of which know about the others, rather than a traffic spike.
Timed out fetching a new connection from the connection pool (Prisma P2024)
This one is Prisma’s pool, not PostgreSQL’s. The database can be completely healthy while Prisma refuses the query, because a query waited longer than the pool’s acquisition timeout for a free slot. Prisma’s error reference prints both numbers involved in the message itself, the current pool timeout and the connection limit, which tells you which of the two to look at.
Check Prisma’s version before changing anything, because v6 and v7 read their pool settings from different places. Then check whether the slots are genuinely all busy or whether one slow query is holding them.
Connection terminated due to connection timeout (node-postgres)
Node pg throws this when a client cannot finish connecting inside connectionTimeoutMillis. Its sibling message, timeout exceeded when trying to connect, is thrown when a queued checkout request gives up waiting for a free client. Both strings come straight from pg-pool’s source. A checkout timeout can occur before a new database connection is attempted. A connection timeout can happen after the server was reached but before SSL, authentication, or setup completed.
A checkout timeout usually means the pool is full of clients that are busy or leaked, not that the database rejected you. Check waitingCount before you raise max.
Max client connections reached (Supavisor)
Supabase’s pooler refused the client. Supavisor has a client-connection ceiling that is separate from the database’s own connection ceiling, which is the whole point of a pooler: many client connections multiplexed onto fewer database backends. Both numbers are listed per compute size in Supabase’s compute and disk documentation, and both are worth reading before you change a pool size.
The trap is the connection route. If some traffic goes through the pooler and some goes directly to PostgreSQL, you have two ceilings being consumed at once and only one of them is visible in whichever report you happened to open.
Check whether the app opens Postgres connections at all
A browser using supabase-js normally talks to the Data API. Each browser request does not create a direct PostgreSQL connection from the browser. Connection-pool diagnosis belongs to a backend, ORM, job, serverless function, or other process that uses a PostgreSQL connection string.
This matters most if you did not write the connection code yourself. An app scaffolded by Lovable, Bolt, Base44, Replit, Cursor, or Claude Code often mixes both patterns: the front end reads through the Data API while a route handler, a cron job, or an added Prisma layer opens real Postgres connections. Only the second group can exhaust a pool.
Supabase’s connection guide assigns each route a specific job:
| Workload | Connection route |
|---|---|
| Browser or mobile client | Data API with row-level security |
| Persistent backend with suitable IPv6 connectivity | Direct connection |
| Persistent backend on an IPv4-only network | Shared Supavisor session mode on port 5432 |
| Temporary serverless or edge clients | Transaction mode on port 6543 |
Use the exact string shown by the project’s Connect panel. Port 5432 alone cannot distinguish a direct connection from Supavisor session mode because both use it. Transaction mode also does not support prepared statements, so the client library must use the compatible setting documented for that route.
Find what is holding the connections
Supabase’s Observability area reports database connections, shared-pooler client connections, and dedicated-pooler client connections separately. On PostgreSQL, pg_stat_activity can group current connections without terminating anything:
select
  coalesce(application_name, '') as application,
  usename,
  state,
  count(*) as connections
from pg_stat_activity
where datname = current_database()
group by application_name, usename, state
order by connections desc;
Read the result with the error layer:
- Many direct connections from the application point to a missing server-side pooler, excess application instances, or a client created repeatedly.
- A growing number of
idle in transactionsessions points to transactions that begin and never promptly commit or roll back. - A normal connection count with a growing application wait queue points to a small local pool or work that holds each client too long.
- High pooler client connections with modest PostgreSQL backend connections mean the server-side pooler is multiplexing successfully, but its client ceiling can still be reached.
One snapshot is weak evidence. Capture it during the failing load and compare it with a quiet period. Also record query duration, request concurrency, and instance count so a pool of 10 in one process is not mistaken for a total of 10 across a deployment.
Fix the cause instead of only extending the timeout
Use the connection route for the runtime
For a persistent backend, create one application pool per process and reuse it. For temporary serverless clients, use the transaction-mode string that Supabase provides. An external pooler multiplexes many client connections onto fewer PostgreSQL backend connections. The guide to connection pooling in Postgres covers what a pooler does, the pool size math for serverless, and PgBouncer setup.
Running an application pool in front of a server-side pooler still needs a small, deliberate local limit. Separately, Supabase warns against enabling both its shared Supavisor pooler and dedicated PgBouncer without accounting for both server-side pools, because their combined database connections can exceed the limit on smaller compute tiers.
Every serverless instance opens its own pool
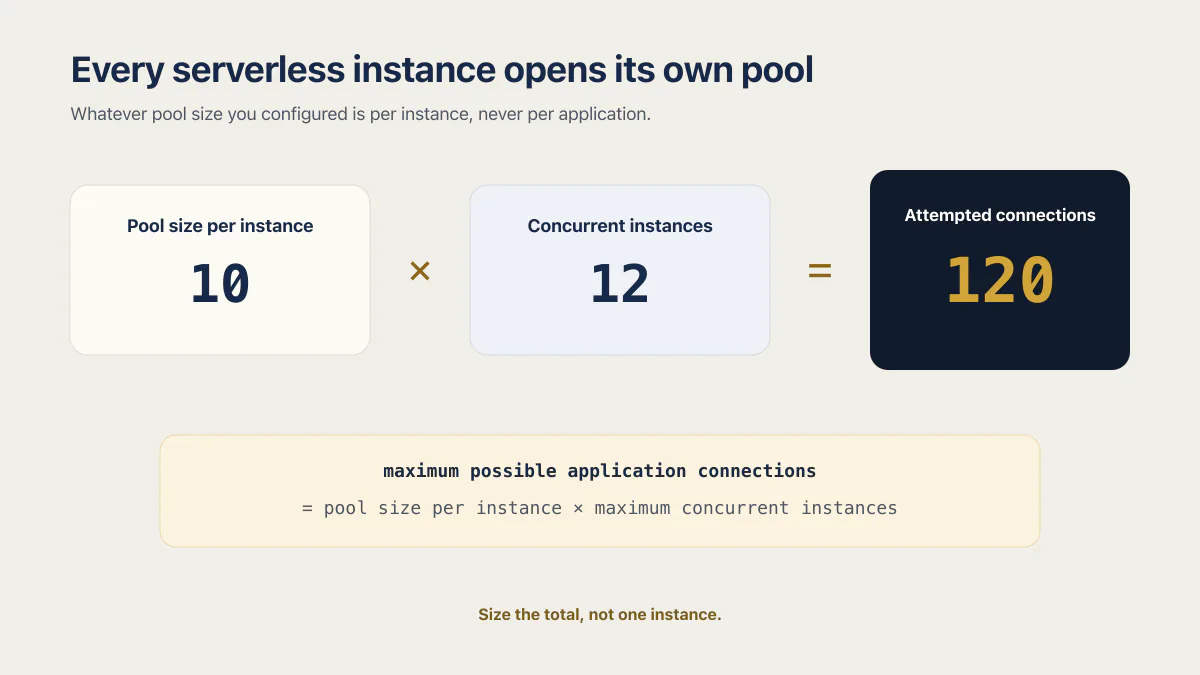
Vercel, Netlify, AWS Lambda, and Supabase Edge Functions all run your handler in many isolated instances. Each instance loads your module once and builds its own pool. Whatever pool size you configured is per instance, never per application.
Here is the version of this that actually happens. An app deployed from Lovable or Bolt runs Prisma on Vercel. One Prisma Client per function instance, pool size left at the default. For six weeks traffic is light, one or two instances stay warm, and nothing breaks. Then 40 people arrive at once, the platform spins up a dozen instances to serve them, and every one of those instances opens a full pool of its own. No code changed. The connection budget did.
Size the total, not one instance:
maximum possible application connections
= pool size per instance × maximum concurrent instances
Ten connections per instance across twelve concurrent instances is 120 attempted connections. Smaller Supabase compute sizes cap database connections well below that, so the refusals start long before the app itself feels busy.
Prisma v6 gives a measured starting point for long-running processes: (physical application CPUs * 2 + 1) / application instances, followed by workload testing. For serverless processes, Prisma recommends starting with connection_limit=1. Supabase also recommends transaction mode with a connection limit of 1 as a starting point for serverless traffic. These are Prisma v6 starting points, not generic rules for every PostgreSQL client.
Leave capacity for Supabase services, migrations, administration, and other workloads. The dashboard’s current compute and pooler limits are authoritative; a number copied from another project’s plan is not.
Return checked-out clients on every path
A connection leak is a client that gets checked out and never returned. It is the most common cause that survives every pool-size increase, because a bigger pool just takes longer to drain.
With node-postgres, create a single Pool. Use pool.query() for a single statement because it checks out and returns the client automatically. Transactions require an explicit checkout and a finally block:
import pg from "pg";

const { Pool } = pg;
const pool = new Pool({
  connectionString: process.env.DATABASE_URL,
  max: 5,
  connectionTimeoutMillis: 10_000,
  idleTimeoutMillis: 30_000,
});

export async function updateOrder(id, status) {
  const client = await pool.connect();

  try {
    await client.query("begin");
    const result = await client.query(
      "update orders set status = $1 " +
        "where id = $2 returning id, status",
      [status, id],
    );
    await client.query("commit");
    return result.rows[0];
  } catch (error) {
    await client.query("rollback");
    throw error;
  } finally {
    client.release();
  }
}
The node-postgres pooling documentation is explicit: a checked-out client that is never released eventually empties the application pool and leaves future callers waiting.
To prove it is a leak rather than a traffic spike, watch the shape of the line rather than its height. A leak climbs monotonically and never falls back during quiet periods, while a spike rises and returns to baseline. The second signal is the per-application count in pg_stat_activity growing steadily while request volume stays flat.
Configure Prisma for the version in the repository
For Prisma ORM v6, configure the built-in pool through the URL:
postgresql://user:pass@host:6543/postgres?connection_limit=5&pool_timeout=10For Prisma ORM v7 with @prisma/adapter-pg, configure the supplied driver instead:
import { PrismaPg } from "@prisma/adapter-pg";
import { PrismaClient } from "./generated/prisma/client";

const adapter = new PrismaPg({
  connectionString: process.env.DATABASE_URL,
  max: 5,
  connectionTimeoutMillis: 10_000,
  idleTimeoutMillis: 30_000,
});

export const prisma = new PrismaClient({ adapter });
Instantiate Prisma Client once per process, outside the request handler. Choose max from the database budget and maximum instance count. Increasing a timeout gives existing work longer to finish; it does not create capacity.
Shorten the work that occupies each slot
A pool can be correctly configured and still fill because queries or transactions hold clients too long. Keep network calls outside database transactions, add timeouts to external dependencies, index the measured query path, and bound returned rows.
PostgreSQL has two guardrails for this and both are off by default. statement_timeout aborts any statement running longer than the value you set, and idle_in_transaction_session_timeout terminates a session that has been sitting idle inside an open transaction. Both are documented as defaulting to zero, meaning disabled. Set statement_timeout above your slowest legitimate query with room to spare, because too low a value turns a slow page into a failing one. Set idle_in_transaction_session_timeout above your longest legitimate transaction, which for most application code is seconds rather than minutes.
If the connection count looks ordinary while query time grows, the problem is speed rather than capacity: that diagnosis, Supabase’s status page first, then the query shapes behind it, deserves its own separate walkthrough.
Repeated relation lookups can also keep slots occupied longer than expected. A list query followed by one lookup per row, the N+1 pattern chief among them, feeds directly into the same ceiling and gets a full dedicated fix elsewhere.
Verify the repair under controlled load
Concurrency is a common trigger for connection exhaustion, but a leak can fill a pool across sequential requests too. A demo, a solo test session, and local development rarely exercise either pattern for long. The audit record says the gap almost never gets rehearsed: across the AxonBuild June and July 2026 cohort, at least 23 of 26 audited apps shipped without a single working automated test, so nothing in those codebases would have opened a second concurrent connection before real users did.
Run the test against a non-production environment with representative data. Increase concurrency gradually, stop below the provider’s hard limit, and record four values at each step: successful requests, failed requests, pool waiters, and database or pooler connections. The guide to load testing a web application covers how to run one, what to measure, and how to fix the first bottleneck. For an API backend, API load testing covers the numbers to record by route and which bottleneck to fix first.
- 01 Confirm the deployed host, port, and connection mode rather than inferring them from a local environment file
- 02 Reproduce the exact error while recording application pool and database connection counts
- 03 Apply one change at a time: route, leak, pool budget, query, or transaction duration
- 04 Repeat the same load and confirm waiters drain, connections return to baseline, and errors stop
- 05 Keep an alert on pool wait time or connection utilization so the next approach to the ceiling is visible before requests fail
Why an AI app stalls under concurrent traffic owns the wider scaling diagnosis. This page owns the narrower question in the log: which connection layer is exhausted, what is occupying it, and which setting or code path actually needs repair. If the queue times out silently instead of erroring loudly, that is the same failure from a different angle, a request answering 200 OK that never told anyone it failed. For the alert in the checklist above, the page on how to alert on error rate spikes covers connection pressure alongside errors, latency, queue backlog and spend, with a test for each.
Common questions about connection pool exhaustion
What does “remaining connection slots are reserved” mean?
It means PostgreSQL has reached its connection ceiling minus the slots it holds back for administrators, so it will now accept new connections only from superusers. Those reserves are superuser_reserved_connections, which defaults to 3, and reserved_connections, which defaults to 0. The connection is refused while slots technically remain, because the last few are kept free so someone can log in and fix the database.
How do I kill open connections on Supabase?
Query pg_stat_activity in the SQL editor to list current sessions, then call pg_terminate_backend(pid) for the specific process ids you reviewed and want to end, never for a whole state at once. Target idle in transaction sessions that have been idle for minutes, because no statement is running inside them (their uncommitted work rolls back), and leave active sessions alone unless you know what they are doing. Terminating connections buys minutes during an outage and does not fix the cause, since the same code path refills the slots.
How many database connections does my Supabase plan allow?
The limit comes from your compute size rather than your billing plan, and Supabase publishes both the database connection ceiling and the pooler client ceiling per compute size in its compute and disk documentation. Read your own project’s numbers there and in the dashboard rather than copying a figure from another project. Leave headroom, because Supabase services, migrations, and administrative access consume connections from the same ceiling. Realtime holds a separate concurrent-connection ceiling of its own, and Realtime connection limits and slow channels are their own diagnosis.
Does restarting my app fix too many connections?
It usually helps for a few minutes and rarely fixes anything. Restarting closes your application’s client sockets, but PostgreSQL backends that are still executing statements hold their slots until those statements finish or the sessions are terminated. If the same route, job, or serverless instance count caused the exhaustion, it will refill the ceiling as soon as traffic returns.
Does raising the connection pool size fix exhaustion?
It fixes a pool that is genuinely smaller than the supported workload. It can worsen a database-side limit when every application instance opens the larger pool. Calculate the total across instances, preserve database headroom, and fix leaks or slow work first.
Why does connection pool exhaustion appear only in production?
Production adds concurrent requests, more application instances, longer data histories, and background work. A leak can also accumulate through sequential requests, so concurrency is a common trigger rather than a requirement.
What is the safest first change for Supabase serverless functions?
Confirm that runtime traffic uses the transaction-mode connection string from the project’s Connect panel, then set a small application-side pool budget appropriate to the maximum number of function instances. Recheck prepared-statement compatibility before deploying the change.
If you have a working app built with these tools and need it ready for real customers, this is what we do.
Built it with AI. Now it has to hold up for real customers.
The Production Hardening Sprint takes the app you already have and builds the production foundation underneath it. Authentication and access rules, payments that stay consistent, error handling, monitoring, backups, automated tests and a documented handover. Our engineers work inside your existing codebase for ten working days. All 123 deliverables are included, and you get the evidence for each one.
See the Production Hardening Sprint →  $2,500 fixed price · 10 working days · One codebase