The list usually starts in a phone note. Something in the app does the wrong thing, you write it down, you carry on selling. A week later the note has eleven lines on it, three of them from customers, and the question stops being about any single line. It becomes the one people actually type: is it normal for my app to have this many bugs, or is a list this long the first visible edge of something structural?
One owner wrote the same question down in public with a trigger attached to it:
We’re currently at 29k online visitors and i know once we get 3x or 4x the visitors, we need to get rid of our current vibe coded website and re build it from the ground up properly.
That is two states of one app: fine at this size, wrong at four times the size. What nobody publishing on this question supplies is the boundary between the two. In a search pull run on 25 August 2026 for the question in this page’s title, nine results came back, and none of the seven that could be read printed a count for a single app.
The two closest to the question were read the same day. A bug-capture vendor’s explainer at birdeatsbug.com/blog/what-does-it-mean-when-an-app-has-a-bug, dated 13 November 2025, grades bugs from “minor annoyances, like misaligned text” up to “major problems that make an app unusable” and puts no threshold between them. A set of seven bug statistics at shakebugs.com/blog/app-bugs-statistics/, dated 11 September 2024, counts abandoned apps and developer hours instead. Neither is linked here: both sell bug tooling to the reader this page is written for.
A normal bug count does not exist. Across 21 AI-built apps audited in June and July 2026, the audit ledger recorded about 46 confirmed findings each, and about three of those were the kind that stops you. The mix of severities decides whether an app is in trouble; the length of your list barely moves it.
Every figure below was read out of AxonBuild’s own audit records for the 26 apps reviewed in June and July 2026 and sorted here per app and by severity, a cut those records hold and no page here has printed per app before; the outside research on bug counts was read on 25 August 2026, and nothing was run against anybody’s app to write this.
The two counts you are confusing
There are two lists. The one on your desk is what you noticed. The other one is what is in the app, and you have never seen it, because seeing it takes a second account, a stranger, a card that declines, or somebody’s afternoon spent reading the code instead of using the product.
The two lists overlap less than anyone expects. Your list is made of things that happen on your screen, on your account, with your data, at your one-person level of traffic: a button that does nothing on mobile, a total that rounds oddly, an email that arrives twice. The app’s list is made of things that happen to somebody else: a second customer reading the first customer’s rows, a signup endpoint that anyone can run ten thousand times, a version of the framework with a published hole in it, an error nobody records anywhere when a customer hits it.
An owner posted to a builder’s community on 22 July 2026 under the heading “Build something, if the demo works but the actual product is full of bugs”. That heading is the whole gap in fourteen words. The demo runs on your list. The product runs on the other one.
This matters for the counting because the two lists grow from different causes. Yours grows when you use the app. Theirs was fully written the day the code shipped, and it sits at whatever size it already is whether you keep a note or not. Which of these an owner could ever have spotted from using their own app is a separate sort of the same list, and it is worked through where the recurring problems are counted.
So when you ask whether eleven is a lot, the honest first answer is that eleven is a count of what reached you. It says something about your attention and your traffic, and very little about the app.
What was actually found per app
Between June and July 2026, 26 real applications went through the same review: 11 third-party apps in the deep-audit group, 10 more third-party apps held back to check the method, and 5 of my own production apps. Across the 21 third-party apps, the audit ledger behind those numbers records 958 confirmed findings, split into 58 confirmed critical, 362 medium, 403 smell and 135 hygiene. Confirmed there means adversarially checked against the code, not matched against a pattern.
| Severity, in the audit’s own names | Findings across the 21 apps | Average per app, same 21 apps |
|---|---|---|
| Confirmed critical, the kind that stops you | 58 | about 3 |
| Medium, a real defect with a bounded blast radius | 362 | about 17 |
| Smell | 403 | about 19 |
| Hygiene | 135 | about 6 |
| All findings | 958 | about 46 |
Every number in the right-hand column is the left-hand column divided by 21, and it is an average over the same 21 apps rather than a description of any one of them. That distinction is the whole reason the next table exists.
Forty-six findings per app is an average over 21 apps. Where the notes record a per-app count, those counts run from four to fifty-two, and each is a floor.
The audit notes for individual apps carry their own counts. Five of them, described in the plainest terms the notes allow:
| The app, in one neutral clause | Score and band | Confirmed criticals | Mediums recorded |
|---|---|---|---|
| A dashboard with no backend, every record a fixed list in the code | 81, amber | 0 | 4 |
| A small classifier with no server behind it | 71, red | 1 | 7 |
| A voice-AI toolkit, the most mature codebase in the set | 70, red | 1 | 13 |
| A tool for drafting incident timelines | 57, red | 2 | 15 |
| A public question-and-answer platform, 52 findings recorded in all | 48, red | 2 | 21 |
Read that table with one caveat in place. The per-app counts come from the distilled ledger of 420 notable findings rather than from the full 958, so the medium column is a floor rather than a total, and those numbers cannot be subtracted from the 958 to leave a remainder. What they are good for is shape: the ratio of criticals to everything else, and the spread from one app to the next.
The spread is the part that answers the title. On the counts these notes record, one app in the set carried four findings in total and another carried fifty-two, and the app with four was the highest-scoring app in the whole cohort while the app with fifty-two sat near the bottom. Both were built the same way by owners asking the same question. There is no normal count to be inside of, and a benchmark that told you eleven was fine or eleven was alarming would be inventing a number nobody has.
Which three of your forty-six actually matter
Confirmed critical means a defect somebody outside your company can reach and use, verified against the code rather than guessed from a pattern. In the 21-app third-party group, 58 findings met that bar out of 958 recorded, an average of about three per app across those 21.
The 58 were not exotic. Three shapes recur through the audit notes, and none of them needs code to understand.
The first is other people’s data. A signed-in customer reaches rows belonging to a different customer, or an anonymous visitor reaches them with no account at all. The app looks correct from inside your own login, because your own rows are the ones you are meant to see.
The second is money leaving without a sale. An endpoint that runs a paid model, sends an email, or starts a job, reachable by anyone who knows the address. Nothing about that is visible in the product; it shows up on a bill.
The third is a known hole in something you did not write. The app runs a version of a framework or a library with a published, reachable flaw, which means the instructions for using it are already online and the fix is usually a version number.
The remaining 900 findings were real and were mostly not urgent: missing error tracking, no test around the payment path, a build that ships without a typecheck, dependencies a year behind. That work is a queue. Queues get worked through in the order that suits the business, and a queue of forty is not an emergency because it is forty.
What this does to your own list is sort it. Almost everything you have written down is in the second group as an audit grades it, because you found it by using the app; some of those items may still be the ones stopping customers today, which is a separate question about urgency. The three that would show up as critical in an audit are usually not on your list at all, which is an uncomfortable thing to discover and a much better thing to discover early.
How buggy is too buggy? Where the line falls
Too buggy has a threshold, and the threshold is reach. An app is normal for its age while its faults stay visible, bounded and inside the owner’s own view of the product, and it is structurally wrong once a fault crosses to another person’s data or money, or once repairs stop holding. Four tests separate the two.
None of the four requires reading code. The first and fourth take an afternoon for the person who owns the app; the second needs a week of watching after one repair, and the third needs a month of your own feature and fault history to compare.
- 01 Do the wrong things happen to other people, or only to your own screen? Make a second account, put something in it, and try to reach it from the first. A wrong total on your dashboard is a defect. One customer seeing another customer's rows is a different category of problem, and it is one the audits graded as a ship-stopper.
- 02 Does a repair hold, or does the same failure come back somewhere else? Fix one item, then watch the two or three things nearest to it for a week. A repair that holds is evidence the code underneath can be reasoned about. The same failure surfacing in a new place is evidence that nobody, human or model, currently understands why it happened the first time.
- 03 Is the list growing faster than the app is? Count what you added to the list this month against what you shipped this month. A young product adds features faster than faults. When that ratio inverts and stays inverted, the cost of each new feature is being paid twice.
- 04 Would anything have caught this before a customer did? Ask where the errors your customers hit are recorded, and what runs before a change reaches production. If the honest answer to both is nothing, then the size of your list is a measure of how many customers have bothered to tell you, which is not the same as a measure of your app.
Test one has a boundary worth naming, because it catches something these four tests do not. A fault that is absent with one person on the app and present with eighty is counted differently from the ones on your list, because nothing about the code changed between those two readings, and what stalls an AI app at a hundred concurrent users is measured as a load result rather than as a defect. Those are the faults that only appear once several people are on it at once, and they belong in their own column.
The audit data lines up behind that line rather than behind any count. In the 26-app cohort, the readiness scores landed between 29 and 81 out of 100, averaging 52.1, with 51 as the middle value, and the bands came out 22 red, 4 amber and none green. A single confirmed critical forced the red band whatever the score said, because the score measured how much work the repairs added up to and the band measured whether the app could be sold to strangers today. That is why an app can sit at 71 and still be red on the strength of one finding.
Now the other end of it, which is the number this page exists to give you. Of the 26 apps, 22 had at least one confirmed critical, and the 4 that had none are exactly the 4 that came out amber. Those four scored 59, 61, 63 and 81. Every one of them still had unfinished work recorded against it: gaps in tests, in error tracking, in what gates a deploy, in numbers displayed as real that were not. That is what normal for a young product looked like in a set of real apps. None of the four was clean or finished, and none of them carried the one kind of finding that forces the red band.
Four of the 26 apps had no confirmed critical at all. They scored 59, 61, 63 and 81, and every one of them still had work left to do.
The 81 is the sharpest version. It had no criticals and four medium findings, in an app with no backend and no real data behind it, which is a good score for the same reason an empty room is easy to keep tidy. At the other end, the app that scored 29 had criticals stacked across storage, identity and dependencies at once. One critical in one place is a repair. Criticals in three unrelated places are the shape people mean when they say the foundation is wrong, and that is a different picture from a long list of small things.
Why the list keeps growing while you fix it
The mechanism is arithmetic rather than bad luck. When a fault is described to a model as a symptom, the repair it writes is aimed at the symptom, because that is what it was given. If the actual cause sits somewhere else, the symptom goes quiet and the cause stays, now with an extra piece of code layered over it. The app accumulates repairs faster than it loses defects, so the list shortens by one and lengthens by two, and the second two arrive later, in a different part of the product, looking unrelated.
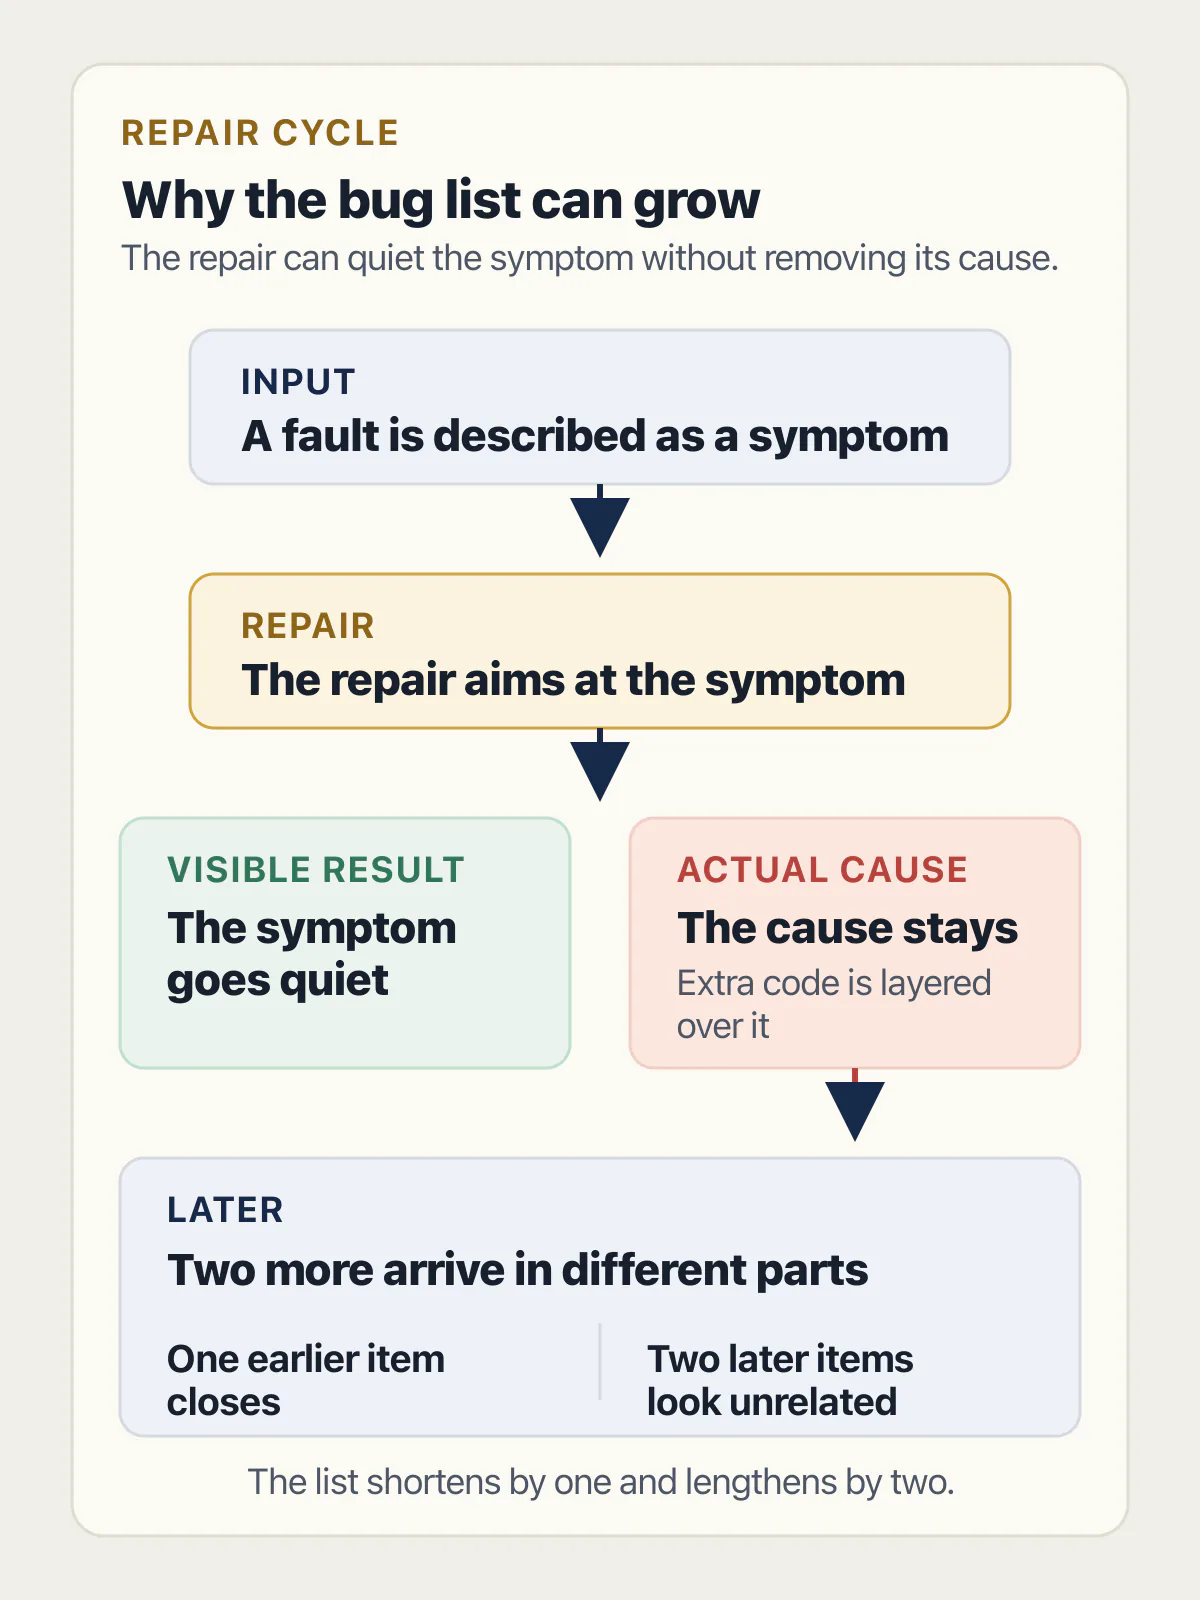
Owners feel this before they can name it. One owner with paying customers described an app full of half-working states, with customers who could see the inconsistency and were losing patience with it, and the frustrating part was not any single fault but the sense that the work was not converging.
That experience has a second cause worth separating from the first. Some of the growth is not growth at all: it is the app’s existing list becoming visible as more people use the product. Faults that need a second account, real traffic or a stranger were already there on launch day. Your tenth customer discovers them; nothing about them was caused by growth.
Why each repair seems to open two more is a question about what a model can judge about its own output, and it has its own answer.
The practical read: a list that grows while you fix things is normal and not, on its own, evidence of a wrong foundation. A list where the same fault keeps returning in new places is the second test above, and that one is evidence.
What to do with the list you already have
Sort it before you spend anything on it. Three buckets, decided by what the fault costs and who it reaches:
| Bucket | What belongs in it | What it means for this week |
|---|---|---|
| Stops you | Another person’s data or money is reachable, or the app is unusable for a paying customer right now | Work it first, one item at a time, and stop taking on new features until it is empty |
| Costs you | Real defects with a bounded blast radius: wrong totals, failed emails, a flow that only completes on the second attempt | Schedule it. Order by how much of your week it eats or how many customers touch it |
| Waits | Everything you noticed once, on your own screen, and cannot reproduce, plus cosmetic items | Keep the note. Revisit when the first two buckets are quiet |
In the audit records, the items that belong in the first bucket are rarely the ones the owner had already noticed. That is the finding that changes what happens next, rather than any single line on the note.
Two routes from here, depending on which bucket filled up. If one of these is breaking for a real customer right now, the sequence for that starts before this page does, with the point where prompting stops and a person starts. Whether a long list is a reason to start again is arithmetic rather than a feeling about the code, and that arithmetic is worked through where the decision about whether to fix it or start again lives.
One defect that has survived ten attempts is a different problem from a long list, and what the eleventh attempt costs is worked out on its own page. Whether the app was built properly underneath is the wider question this page sits inside, and the six things that can be wrong under an app that works are worked through separately.
Worth saying for the owners who are already doing this honestly: a post to a testing community on 19 August 2026 was titled “I know some of what’s broken. Looking for people to find the rest”. That is the correct posture and it is rarer than it should be. Knowing your list is partial is the difference between an owner who is managing a young product and one who thinks a quiet week means a clean app.
Common questions about how many bugs is normal
How many bugs per 1000 lines of code?
The count depends entirely on what is being counted and over what period, so no single figure transfers to your app. The number that circulates, about 15 to 50 errors per 1000 lines of delivered code, traces to one book. Two of the pages ranking for that question print the range and attribute it to Steve McConnell’s Code Complete. Neither gives a page number. Both link the book’s listing on a shop, and one of them also links a 2007 blog post asking where the figure came from: labs.sogeti.com/how-many-defects-are-too-many/, dated 29 October 2014, and mayerdan.com/ruby/2012/11/11/bugs-per-line-of-code-ratio, a personal blog post from 2012, both read on 25 August 2026. They are named without links because they are the pages this answer is correcting.
The research version is narrower and better defined. A 2012 scoping study by Syed Muhammad Ali Shah, Maurizio Morisio and Marco Torchiano defines defect density as the cumulative number of post-release defects divided by size in thousands of lines of code, measured at the end of the observed period. Pooling 19 papers, its dataset of 109 projects gives a mean of 7.47 defects per KLOC, a median of 4.3 and a standard deviation of 7.99, with closed-source projects at a mean of 8.6 and open-source at 4.66. The paper is cited here as doi.org/10.1109/APSEC.2012.93, unlinked because that record returned no readable full text when it was fetched on 25 August 2026; the figures above were read from the authors’ own slide deck of the same study, slideshare.net/slideshow/an-overview-of-software-dd-a-scoing-study-15589514/15589514, unlinked because it is a slide-hosting page rather than the publisher’s record.
Steve McConnell’s own Gauging Software Readiness With Defect Tracking, dated May/June 1997 on his site, makes the point that settles this question: a defect rate is guidance only when you have your own history to compare it against, and with data from only two projects the range is wide enough to leave the judgment open. Its worked figures belong to an invented project, so they are not repeated here.
Three numbers, three different things being counted over three different periods. The one that came out of the audits, about 46 confirmed findings per app across 21 third-party AI-built apps, counts findings from a code review at one moment rather than defects reported after release, so it does not convert to a per-KLOC rate and should not be compared to one.
What does it mean if your app has a bug?
For an AI-built app, it usually means the code does exactly what it was asked to do in a case nobody thought to ask about. The generator writes the path it was prompted for. The second account, the declined card, the empty state, the customer who pastes 4,000 characters into a name field: those paths exist in the running app whether anyone described them or not, and whatever the code does there is what it does. One bug is a fact about coverage, not a verdict on the app.
Why do my apps have bugs?
Because the parts nobody prompted for still ship. A generator produces what the prompt describes, and prompts describe features: the signup, the dashboard, the checkout. Nobody prompts for the error path, the retry, the empty state, the second user, or the check that proves the first four work, so those parts get whatever the model guessed. That is also why the 958 findings across those 21 apps sit mostly in the lower severities. Most of what those findings describe is missing work rather than danger.
How do you get a bug out of an app?
Reproduce it before you touch it. Write down the exact steps, the account you were signed in as, what you expected and what happened, then confirm you can make it happen twice. Half of what looks unfixable is two different faults sharing one description, and they separate the moment somebody writes the steps down. Only then is it worth handing to a person or a model, because a repair aimed at a symptom nobody has pinned down is the mechanism that grows the list.
How to fix bugs in apps?
Work the buckets above in order, one item at a time, and check the fix from a second account rather than the one you built it in. Two rules keep this from going sideways: change one thing per attempt, so you can tell which change did what, and set a limit on attempts before you start. If the same fault survives several rounds, the next useful step is somebody reading the code rather than another description of the symptom.
Is a long bug list a reason to rebuild the app?
Almost never on its own. In the audit data the band moved on the presence of one confirmed critical rather than on the total count, and one app carrying fifty-two recorded findings still had exactly two criticals. A rebuild earns its price when the shape of the stored data blocks something the business has already sold, or cannot keep one customer’s records apart from another’s. That is a different problem from a long list of faults in the code around it.
How many bugs did each of the audited apps have?
The audit notes record per-app counts for individual apps, and among the five printed above they run from four findings on a no-backend dashboard scoring 81 to fifty-two on a question-and-answer platform scoring 48. Those counts come from a distilled ledger of 420 notable findings rather than the full 958, so treat each one as a floor. The four apps in the 26 with no confirmed critical at all scored 59, 61, 63 and 81.
Should I be writing every bug down, or just fixing them as they turn up?
Write them down, because the list is the only thing that shows you the pattern. Fixing as you go hides the two signals that matter: whether the same fault keeps returning under different descriptions, and whether the list is growing faster than the product. Both need a written history to be visible at all. Keep it dull, one line each, with the date and who found it, and put a mark against the ones a customer reported rather than you.
Built it with AI. Can’t get the last part right?
That’s the normal state of an AI-built app, and it’s fixable. I trace what the app actually does, explain what needs changing, and build it if you want me to.
Talk about your app →  Free 20-minute video call with Bilal.