If your app went viral and the site is now slow, timing out, or down, stabilize the system before you add features or optimize conversion. Do these five things first:
- Pause risky deploys and confirm you can roll back the current build.
- Protect the endpoint that can spend money or mutate important data.
- Capture error and latency evidence before the dashboards age it out.
- Identify the actual bottleneck from the measurements you just captured.
- Add capacity only after those measurements show which resource is saturated.
A sudden traffic spike leaves a founder handling capacity, cost, and failure response at once. This page puts those decisions in order.
The first 48 hours have two goals: keep the core workflow honest for users and leave yourself a safe way back from every emergency change.
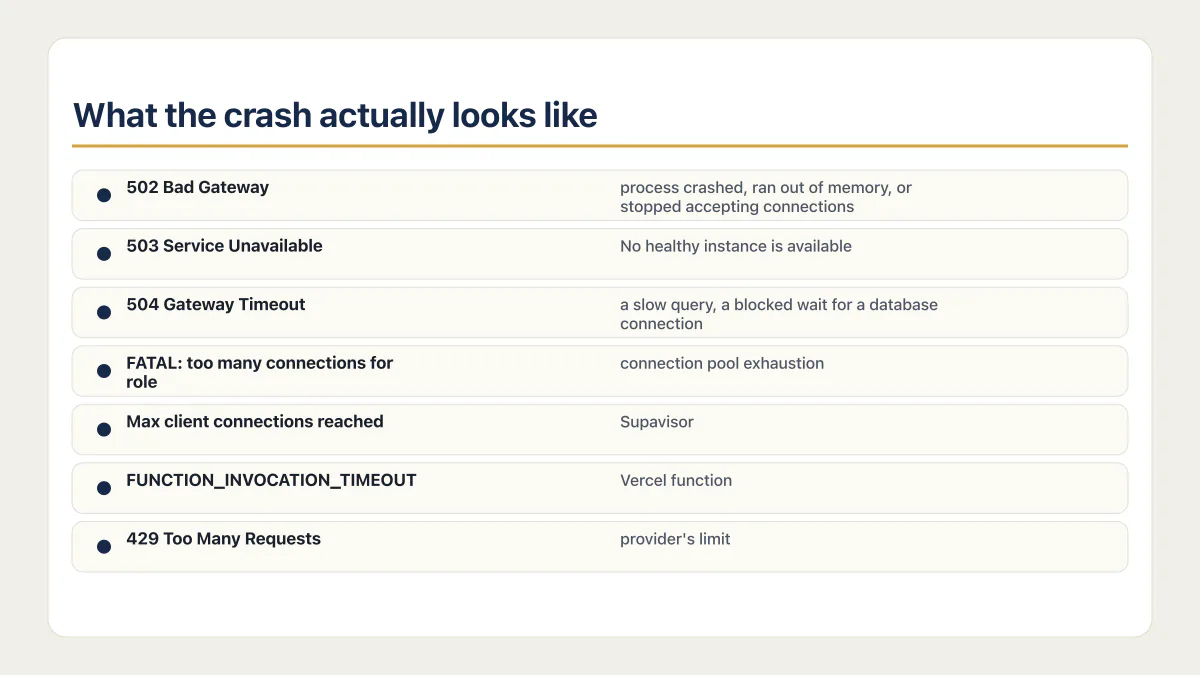
What the crash actually looks like
Most founders search the error text before they search the problem. Here is what the common ones mean when the cause is a traffic spike.
| What you see | What it usually means |
|---|---|
502 Bad Gateway | The proxy or load balancer reached your app and got nothing usable back. The process crashed, ran out of memory, or stopped accepting connections. |
503 Service Unavailable | No healthy instance is available to take the request. Common during a restart loop, a failed deploy, or when every worker is already busy. |
504 Gateway Timeout | Something accepted the request and never finished it. Usually a slow query, a blocked wait for a database connection, or a third-party call with no timeout. |
FATAL: too many connections for role | Postgres refused the connection because the role or database is at its cap. This is connection pool exhaustion, not a CPU problem. |
remaining connection slots are reserved for non-replication superuser connections | Same cause, different wording: every non-superuser slot is taken. Supabase documents this one directly. |
Max client connections reached | Supavisor, the Supabase pooler, is out of client slots in transaction mode. Supabase’s guidance is to raise the pool size, fix slow queries, and close clients that never disconnect. |
FUNCTION_INVOCATION_TIMEOUT | A Vercel function ran past its duration budget. Vercel returns it as a 504. |
429 Too Many Requests from a model or email provider | You crossed the provider’s limit. On the Claude API that arrives as rate_limit_error, and a 529 overloaded_error means the provider itself is saturated. |
| A spinner that never resolves, or a blank white screen | The browser is waiting on a request that never returned, or a bundle that failed to load. Check the network tab before touching the server. |
Reddit and Hacker News regulars call this moment the hug of death, and the vernacular is useful: it names a spike of real people rather than an attack. Before assuming the fault is yours, open your host’s status page and your database provider’s status page. A platform incident and a hug of death look identical from the outside. If the first request after a quiet stretch is slow while the next ten are fast, that is a cold start rather than a capacity problem.
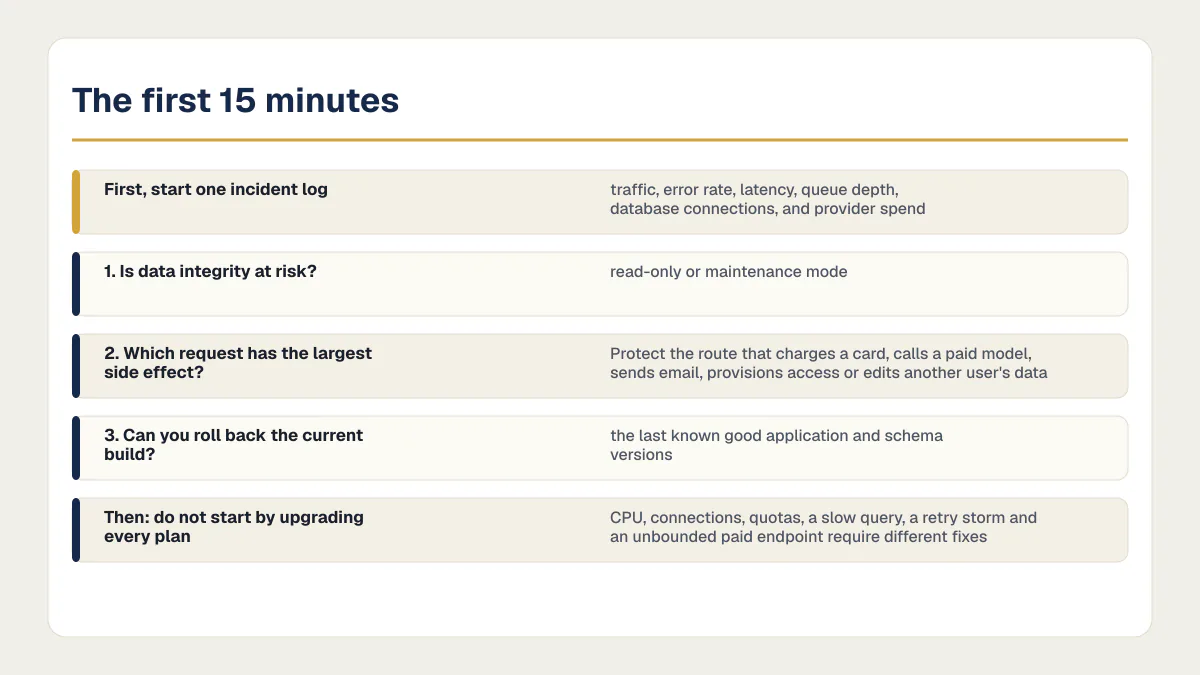
The first 15 minutes
Start one incident log with UTC timestamps. Record traffic, error rate, latency, queue depth, database connections, and provider spend before changing anything. Save screenshots or exports because dashboard retention and aggregation can hide a short spike later.
Then make three decisions:
- Is data integrity at risk? If writes are duplicating, arriving out of order, or failing halfway through, put the affected workflow in read-only or maintenance mode. A smaller honest service is safer than a success screen attached to a partial write.
- Which request has the largest side effect? Protect the route that charges a card, calls a paid model, sends email, provisions access, uploads large files, or edits another user’s data.
- Can you roll back the current build? Freeze unrelated deploys and identify the last known good application and schema versions before the first hotfix.
Do not start by upgrading every plan. CPU, connections, third-party quotas, a slow query, a retry storm, and an unbounded paid endpoint require different fixes.
Where the traffic came from changes the plan
Open the referrer breakdown before you decide what to fix. Treat the source label as context rather than a duration or workload model. For Product Hunt, Hacker News, Reddit, TikTok, or Instagram, read the current referrer mix, requests per second, route concentration, read/write ratio, payload size, signup and upload rate, and arrival curve. Cache only traffic that the measurements show is repeatable and read-heavy; protect write-heavy or paid paths with the limits in the next section. If the launch is still ahead of you, the technical prep checklist is the cheaper version of this page.
Protect the expensive and destructive paths
Apply a temporary limit at the narrowest useful identity boundary: account, API key, user, tenant, or IP when no stronger identity exists. A single per-IP number is not a universal answer. Shared networks can block legitimate users together, while distributed abuse can rotate addresses.
For a paid AI or email endpoint, combine a short-window rate limit with a per-account quota and a concurrency cap. For checkout fulfillment or job creation, add idempotency at the business-operation boundary so a retry cannot create the side effect twice. Return a clear temporary error, and use 429 Too Many Requests with Retry-After where the client can safely retry.
In the AxonBuild historical cohort from June and July 2026, 13 of 21 third-party apps had no rate limit on their most expensive endpoint. That finding describes the reviewed sample, not all AI-built apps. It explains why the highest-cost route deserves attention before a traffic spike turns into an unexplained provider bill.
A spike is also the day strangers actually look at what the app exposes. One AI-powered CMS I audited made this concrete. Its passwordless login route had no rate limit and no cooldown at all: a single script could bomb any inbox, burning the sending quota and tanking the domain’s reputation in an afternoon. A few files over, an image-proxy route took any URL from the query string and fetched it server-side with no login and no allow-list, the kind of route that sits quietly for months and becomes a way to read the server’s own credentials the day someone with the right curiosity finds it. Both routes were missing a check on who may call them, and each needs its own control: a cooldown and rate limit on the login route, a destination allow-list on the proxy. The exposure existed before any spike; under quiet use nobody had found it yet. Under a spike, it is a matter of how many strangers pass through before one notices. Cost and exposure usually trace back to the same missing check, so cover both while you are in the file.
Make failures visible without flooding the system
Capture request count, error rate, and high-percentile latency for the core workflow. Add structured server-side errors with a request or trace identifier, then confirm one deliberate failure reaches the place somebody is watching.
Use sampling for high-volume successful traces, scrub secrets and personal data, and keep error capture for the critical path. An observability change that logs full request bodies or synchronously ships every event can create a new privacy or performance problem under load.
Seventeen of the same 21 audited apps recorded errors nowhere a person would see them. An app that fails silently while returning 200 OK can make a viral launch look healthy while paid actions disappear. During the spike, verify the user-visible result against the database or provider result rather than trusting the status code alone.
Find the bottleneck before buying capacity
| What you observe | First check |
|---|---|
| Database connection errors or timeouts | Connection pool exhaustion first: connection mode, pool size, leaked clients, long transactions, and current active connections. |
| Latency rises with database CPU or I/O | Slow-query logs, missing indexes, rows scanned, lock waits, and oversized result sets. |
| Application CPU or memory saturates | Hot endpoints, cold starts, serialization work, file handling, memory growth, and per-instance concurrency. |
| Queues grow while web requests remain healthy | Worker concurrency, job duration, retries, poison messages, and downstream quotas. |
| A third-party service returns limits or errors | Provider quota, retry policy, timeout, circuit breaker, and degraded behavior. |
| Spend rises without matching successful actions | Duplicate work, bot traffic, retry storms, unmetered endpoints, and abandoned background jobs. |
Supabase illustrates why the connection number needs context. As of August 2, 2026, its Nano and Micro compute sizes list 60 maximum database connections, while larger sizes list different limits and platform services use some connections. Supavisor also distinguishes client connections from backend database connections. Supabase recommends transaction-mode pooling for temporary serverless or edge clients. Check the current compute limits and connection-method guidance for the project’s actual tier and architecture.
A connection limit is not a user limit. One user can open several direct connections, while a pooler can multiplex many client requests over fewer backend connections. Why an AI app can stall under concurrent load owns the full connection, query, and load-test diagnosis.
Four levers get suggested in every thread, and each one fixes exactly one kind of saturation. A CDN or edge cache in front of read-heavy public pages removes requests before they reach your server, and does nothing for signup, upload, or checkout. Autoscaling adds copies of the application, which helps when CPU or memory is the limit and hurts when the database is, because more instances open more connections. A read replica moves reporting and dashboard queries off the primary, and cannot help write-heavy load. A bigger database or compute tier buys headroom only when a tier limit is the thing you actually hit. Pick the lever that matches the measurement.
What breaks first, by the tool you built with
The builder you used chose most of your defaults, so it also decided which limit you meet first. Knowing that saves an hour of guessing.
| Built with | What usually gives way first |
|---|---|
| Lovable | Lovable Cloud is built on Supabase’s open-source foundation, so the same mechanisms are worth measuring first, database connections and egress, while the ceilings themselves are whatever Lovable’s own Cloud plan documents for your tier. Check the pooling mode and the size of the rows and images you send. |
| Base44 | The managed backend handles storage, queries, and hosting for you, so the data model you defined is the part still under your control. One unbounded entity query multiplies by the size of the crowd. |
| Bolt | New projects publish to Bolt hosting by default, with Netlify as an opt-in target, and the database side is usually Supabase, so there are two vendors and two sets of limits to check, not one. |
| Replit | Autoscale Deployments only scale up to the maximum instance count you set, and the Postgres database has its own compute allowance. Read both numbers before blaming the code. |
| v0 | A published v0 app is an ordinary Vercel deployment. Function duration and data transfer are the two meters that move. |
| Claude Code, Cursor, or Windsurf | The app does not run inside the coding tool, so whatever you deployed to sets the limits, including when the tool offers a one-click deploy to somewhere else. The failure is more often a missing rate limit in your own route handler than anything the platform did. |
Underneath those builders sit the same few hosts, and their meters are what turn a spike into a bill. As of August 5, 2026, Supabase measures cached and uncached egress against independent quotas. Free includes 5 GB of each. Pro and Team include 250 GB of each. Paid overage is $0.09 per uncached GB and $0.03 per cached GB when overages apply. Free projects and paid projects with Spend Cap enabled get a notice and a grace period instead. Why a Supabase egress bill spikes covers that meter in full. Netlify and Render bill bandwidth and instance time on their own schedules, so read your current plan page rather than a number from a search result.
The first six hours
- 01 Keep an incident log with traffic, error, latency, queue, connection, and spend snapshots. Name one person who approves production changes.
- 02 Freeze unrelated deploys. Confirm the last known good application build and database schema, plus the rollback path for each.
- 03 Limit the highest-cost or highest-impact endpoint by account or tenant where possible. Add a concurrency cap and idempotent operation key when retries can duplicate work.
- 04 Verify the core workflow end to end. Compare the user response with the database record and any external provider result.
- 05 Identify the saturated resource from current measurements. Change one bottleneck at a time and record the before-and-after result.
- 06 Set provider alerts and quotas where available. Use an application-side circuit breaker or feature flag when a provider has no enforceable hard spend cap.
If a feature can be degraded safely, reduce work instead of dropping the whole app. Serve cached public data, queue non-urgent jobs, lower image sizes, disable optional AI enrichment, or temporarily close a waitlist. Keep login, account access, billing state, and data integrity ahead of decorative features.
Hours 6 to 24: harden the hot path
Inspect the route that now carries the most traffic. Confirm authorization at the object or tenant boundary, cap request and response size, paginate list queries, set timeouts, and make retries bounded with backoff and jitter. Cache only data whose authorization and freshness rules are understood.
Run a focused load test against a staging environment or isolated target with production-like data volume. Increase concurrency gradually and stop before the test threatens production dependencies. Record the first saturated resource and the throughput at which latency or errors cross your acceptable threshold.
Emergency schema changes deserve a separate pause. A frontend rollback cannot reverse a destructive migration. Keep the application compatible with both schema versions during the transition when possible, and test the rollback before applying the migration to production. A single production database with no staging boundary becomes especially risky during a rushed traffic response.
Hours 24 to 48: remove temporary risk
Review every emergency rule and hotfix. Replace broad IP blocks with account-aware limits, remove verbose logging that contains sensitive data, confirm alert thresholds, and write down temporary capacity changes and their cost. Test rollback while the people who made the change are still available.
Build a short capacity record:
- peak requests per second and concurrent users;
- successful core actions per minute;
- p50, p95, and p99 latency for the core route;
- database connections, CPU, I/O, lock waits, and slow queries;
- queue depth and oldest-job age;
- third-party quota use, error rate, and spend;
- the first observed failure and the change that moved it.
Put a price on the transfer line while you are there. Start with the active Vercel plan. As of August 5, 2026, Hobby includes 100 GB of Fast Data Transfer and Pro includes 1 TB. Hobby does not charge for additional usage and can pause after a limit is exceeded. Pro uses regional on-demand rates that start at $0.15 per GB beyond the included amount. Apply only the rate shown for the plan and traffic region. The uncompressed hero image then stops looking like a design detail.
This becomes the baseline for the next event. “It survived” is less useful than knowing the workload, limit, and remaining headroom.
None of these bills needed the spike to exist. The missing rate limit, the silent errors, and the unpooled connections were in place before the traffic arrived. A spike only moves up the due date. A rate limit, an error tracker, and a tested rollback in place beforehand would have reduced the damage.
Common questions after an app goes viral
Should I upgrade the server during a traffic spike?
Upgrade when measurements show CPU, memory, I/O, or a documented tier limit is the bottleneck and the larger tier adds the needed headroom. An upgrade will not fix an unbounded query, leaked connections, duplicate paid calls, missing authorization, or a saturated third-party quota.
How do I stop a runaway API bill?
Limit calls inside the app by account or tenant, cap concurrent work, set usage quotas, and disable optional paid features with a server-side flag. Add provider budget alerts and hard caps where the provider actually enforces them. Alerts alone notify you after spend has started; they do not stop the request path.
Should I put the app in maintenance mode?
Use maintenance or read-only mode when continued traffic can corrupt data, duplicate financial actions, expose other users’ records, or make recovery harder. If the failure affects one optional feature, disable or queue that feature and keep the rest of the service available.
How do I know whether the database is the bottleneck?
Correlate rising request latency with database connections, CPU, I/O, locks, slow queries, and rows scanned. Check the application’s connection method and pool behavior. A database plan limit without matching saturation is not evidence that the database caused the slowdown.
Will Cloudflare or a CDN fix this?
A CDN fixes read-heavy traffic to public pages, and only where the measurements show the responses are repeatable and cacheable. An edge cache serves the same HTML, images, and static files from a location near the visitor, so most of those requests never reach your server or your database. It does not help with signup, login, upload, checkout, or a personalized page, because those responses differ per user and cannot be cached and stay correct without per-user cache rules; a CDN can still absorb the static assets those pages load and rate-limit or block abusive traffic in front of them.
If the spike came from Hacker News or Reddit and points at one article-shaped URL, a CDN is the highest-value first move. If it came from TikTok and lands on signup, it will barely register.
Should I turn on autoscaling?
Turn it on when the saturated resource is application CPU or memory and each instance holds no state of its own. Autoscaling adds copies of the app, so it makes a database bottleneck worse: more instances open more connections to the same database. Set a maximum instance count and a spend alert before you enable it, because the failure mode is a bill rather than an outage.
Do I need a waiting room or queue?
Only when the bottleneck is a hard limit you cannot raise during the spike, such as a fixed connection cap or a paid API quota. A waiting room protects a working service by admitting people at the rate it can actually serve, which is better than everyone getting a timeout. If the service is broken rather than saturated, a queue only moves the failure later.
How long does a viral traffic spike last?
The source name does not establish how long the spike will last. Read request rate and referrers over time, make temporary capacity changes with an expiry or review point, and remove them when the measured curve has fallen.
Will my hosting bill spike too?
It depends on the plan. Paid plans with on-demand usage can turn data transfer, compute time, and paid API calls into a larger bill. Free plans may enforce a usage limit instead. Check the active plan’s allowance and enforcement before estimating cost. Set spend alerts, and cap the paid endpoints in your own code, because an alert does not block the request unless the provider says it does.
What should I do after the spike ends?
Remove unsafe temporary changes, test rollback and recovery, preserve the capacity record, reconcile failed or duplicated actions, and schedule fixes for the first measured bottleneck. Keep the rate limits, authorization checks, alerts, and failure-path monitoring that proved useful.
Built it with AI. Can’t get the last part right?
That’s the normal state of an AI-built app, and it’s fixable. I trace what the app actually does, explain what needs changing, and build it if you want me to.
Talk about your app →  Free 20-minute video call with me.