The build went up, the store approved it, and someone downloaded it. Then the app closed before the first screen finished loading. An hour earlier the same code ran fine in the builder preview.
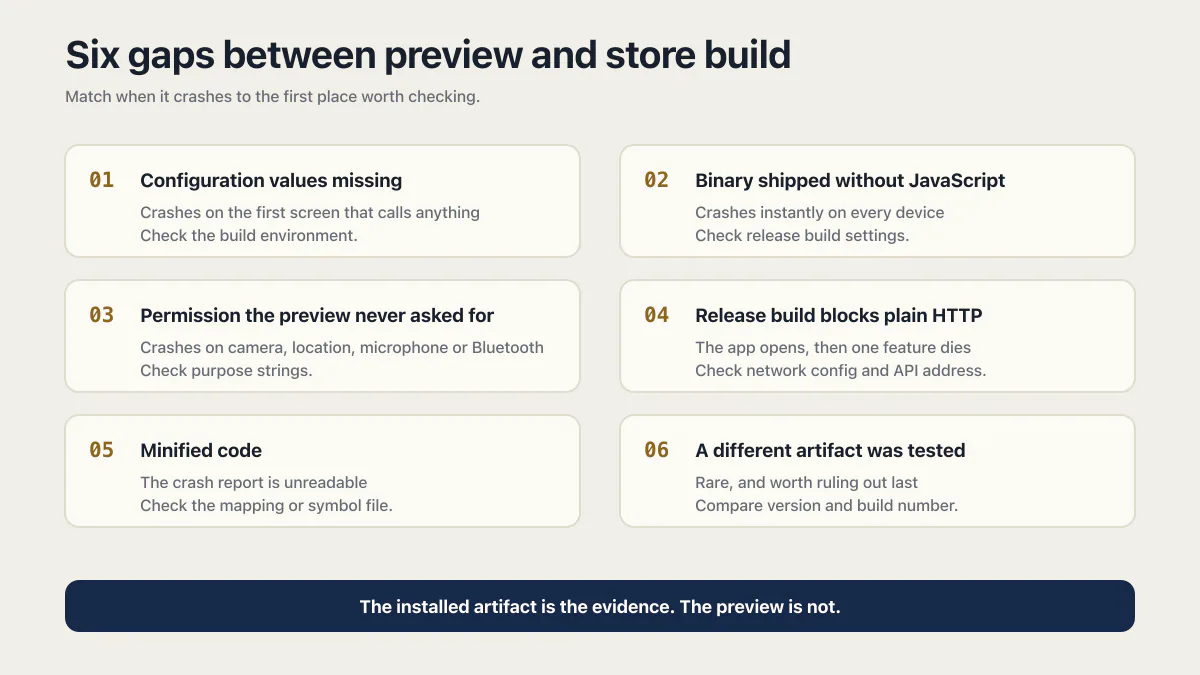
Nothing about that is mysterious once you know what a store build actually is. The preview ran a development build talking to a bundler on a machine you control. The store shipped a distribution-signed binary that a stranger’s phone downloaded and installed, with none of that scaffolding attached. Six differences between those two artifacts organize the diagnosis. Each one is checkable without writing code.
The app in the store is a different build from the one you clicked through in the preview. Four release-only differences can cause these crashes: missing configuration, a missing JavaScript bundle, an absent permission string, and blocked plain-HTTP calls. Two more change what you can diagnose or which artifact reached the device: unreadable minified frames and Play App Signing. Read the crash report before rebuilding.
Every step below is read from Apple’s, Google’s, React Native’s and Expo’s own documentation on 16 August 2026 and is cited to the page it came from. No app was built, published or crashed to write it.
What is different about the app they downloaded
Start by separating this from the problem it looks like. Why an app works locally but not in production covers a web app that runs on your laptop and fails on a server: a missing variable on the host, a call still pointed at localhost, a migration that never ran. That page has a server, a server log, and a URL you can hit again with the fix.
You have none of those for the crash itself. The app may still talk to a backend you control, and that backend’s log can show which requests arrived and which never did, but the crash happened on the device. A store build is a file. It was compiled, signed, uploaded, distributed, downloaded, and installed on hardware you have never seen. Between the moment you clicked “preview” and the moment it crashed on someone’s phone, six things changed about the artifact itself.
The preview proves your code runs. The store build proves your code runs after it has been compiled, signed, stripped of its development scaffolding, and handed to a phone that has never met your laptop.
| What is different in the store build | What it looks like | Where to look first |
|---|---|---|
| Configuration values never made it into the build | Crashes on the first screen that calls anything | Whether the value existed in the build environment, not on your machine |
| The binary shipped without its JavaScript | Crashes instantly on launch across more than one tested device | The release build settings, not the code |
| A permission the preview never had to ask for | Crashes on the screen that uses camera, location, microphone or Bluetooth | The purpose strings in the app’s information property list |
| Plain HTTP the release build refuses to send | The app opens, then one feature dies | The network security config and the address your API sits on |
| Minified code | The crash report is unreadable rather than the code being wrong | The mapping or symbol file uploaded to the store |
| A different artifact than the one you tested | Rare, and worth ruling out last | The version and build number in the crash report against what you uploaded |
Work down that list as diagnostic hypotheses, not as a measured incidence ranking. Configuration and a missing bundle are settings problems worth checking early because rewriting the screen that crashed will not repair either one. Most of this is also catchable in a pre-submission pass before you publish at all, which is a different job from the one on this page.
Is this actually a release-build crash?
A release-build crash usually shows up from the first install and reproduces across devices, though timing is a clue rather than a rule. Three questions separate it from the other kinds: did it ever work after publishing, does it crash for everyone or only for some, and does it die on launch or on one specific screen. Two of those answers point away from the build entirely.
Did it work at first and start crashing later? Then the packaging is a less likely cause, and a later cause is worth checking first. Crashes that arrive with growth look different: one person on r/replit, describing an app they had been working on since January, said that “app foregrounding was getting slower and sometimes causing crashes” as it grew. That is a load and memory story, not a packaging story, and crashes that only start once more people are using it have their own causes.
Does it crash for everyone or only for some? Reproducing the crash across multiple devices from the first download points toward a shared release path, but it does not identify the cause. A failure on one device model or one OS version points toward device-specific code or an API-level difference. Failures concentrated on slow connections point toward network handling or timeouts.
Does it die on launch or on one screen? A launch crash makes the bundle, startup configuration, and slow initialization worth checking early. A screen-specific crash makes that screen’s permission and network paths worth checking early. Use the crash report to decide which path to test.
One thing worth ruling out before any of this: if the App Store or Play Store app itself is crashing on your phone, that is the store’s own app misbehaving on that device, not a defect in what you published. Check the crash on a second phone before spending an evening on it.
If you have not submitted yet and are reading this to avoid the problem, what has to work on a real device before you submit covers the pre-submission side. On the web, the equivalent question is which environment you are actually looking at when a deployment preview and a production URL disagree, which is a separate diagnosis with separate tooling.
Gap 1: the configuration never reached your production build
Missing configuration is an early cause to check when an Expo app crashes in a production build while development still works. The API key, the database URL, or the auth domain that lives in your .env file is present on your machine and absent in the binary. The first screen that calls anything gets undefined, and the app dies.
Expo’s own documentation says two different things about this, and the gap between them is exactly where founders lose a week.
The EAS environment variables page, read on 16 August 2026, describes local files this way: “These files are generally excluded from the project’s version control (that is, if they are listed in the .gitignore file or not committed) so they are not available for jobs that run on a remote server, for example, EAS Build and EAS Workflows.”
The general environment variables guide, read the same day, says the opposite about the same system: EAS Build “will use .env files uploaded with your build job to inline EXPO_PUBLIC_ variables into your code”.
Both sentences are true, and reading them together gives you the rule. A .env file reaches a remote build only if it is actually inside the project directory that gets uploaded. Starter templates and builder exports routinely gitignore it, so it stays on the machine that created it, and the build runs with those values missing. Nothing errors at build time. The binary compiles cleanly with an empty string where the key should be.
Two mechanics follow from that. First, the substitution is permanent: Expo CLI “will substitute prefixed variables in your code (for example, process.env.EXPO_PUBLIC_VARNAME) with the corresponding plain text” values during export or build. A value that was missing when the binary was built is missing in every copy of that binary forever, and no amount of fixing the dashboard afterwards changes the app someone already installed. Second, which values a build gets depends on which environment the profile selected. A build profile picks that with the environment field in eas.json, and when the field is omitted EAS applies defaults, including production when distribution is set to store.
If the values live in EAS rather than a file, their visibility setting decides what you can see when you go looking. Expo documents three:
| Visibility | What the documentation says |
|---|---|
| Plain text | ”Visible on the website, in EAS CLI, and in logs.” |
| Sensitive | ”Obfuscated in EAS Build and Workflows job logs. You can use a toggle to make them visible on the website. They are also readable in EAS CLI.” |
| Secret | ”Not readable outside of the EAS servers, including on the website and in EAS CLI. They are obfuscated in EAS Build and Workflows job logs.” |
One warning before you fix this by moving every secret into the client. Expo states plainly that “anything that is included in your client-side code should be considered public and readable to any individual that can run your app”. An EXPO_PUBLIC_ variable is baked into the binary as literal text. Anyone who downloads the app can read it. Stopping a crash by shipping a service-role database key into a public binary trades a crash for something worse.
Gap 2: the release binary shipped without your JavaScript
A React Native or Expo app is a native shell wrapping a JavaScript bundle. In development the shell fetches that bundle over the network from a bundler running on your machine. In a release build the bundle is compiled in. React Native’s signed-build documentation puts the consequence in one line: “You can terminate any running bundler instances, since all your framework and JavaScript code is bundled in the APK’s assets.”
Read that backwards and you have the diagnosis. If the preview you approved was talking to a bundler on somebody’s machine, all it established is that your JavaScript runs somewhere. Whether your JavaScript is inside the file you uploaded is a separate question the preview never touched.
There is a documented setting that produces exactly that empty shell. The same page warns: “Make sure gradle.properties does not include org.gradle.configureondemand=true as that will make the release build skip bundling JS and assets into the app binary.” One property in one file, no build error, and every device that installs the result crashes on launch in the same way.
The release build itself runs as npx react-native build-android --mode=release, which uses Gradle’s bundleRelease under the hood and writes the app bundle to android/app/build/outputs/bundle/release/app-release.aab. That path is worth knowing for one reason: it tells you which file was supposed to go up, so you can compare its size against what a working build produced. A binary missing its entire JavaScript bundle is noticeably smaller than one that has it. Publishing a React Native app you vibe coded involves a longer sequence than this one command, but this is the step where the JavaScript either makes it in or does not.
Gap 3: a permission the preview never had to ask for
A screen that uses the camera, the microphone, or someone’s location can work in a development build and crash in the store build for a reason that has nothing to do with your code being wrong.
Apple restricts access to protected data by default, and an app has to supply a purpose string explaining why it wants access. Apple’s documentation on requesting access to protected resources, read on 16 August 2026, is direct about what happens when the string is missing: “Always provide a valid purpose string in the Signing and Capabilities editor if your app uses a protected resource. If you don’t, attempts to access the resource fail, and might cause your app to crash.”
Note the exact wording. Apple says “might cause your app to crash”, not “will”. The access attempt fails in a resource-specific way, and whether that failure takes the whole app down depends on how the calling code handles it. Builder-generated code frequently does not handle it at all.
The documented route to add one is the Signing and Capabilities editor in Xcode: navigate to it, click the Add button to add a capability, choose the protected resource, and enter the purpose string in the text field. Xcode then adds a build setting configuring that string, which for the location example is INFOPLIST_KEY_NSLocationWhenInUseUsageDescription. That route needs a Mac. Without one, the same string can still be set in the project’s own configuration: an Expo project carries purpose strings in its app config under ios.infoPlist, and a bare React Native project carries them in Info.plist itself, so a builder that exposes those files can make the change. If your builder does not expose the project files, this becomes a job for whoever built the app or whoever you hire to finish it, because the fix lives in configuration rather than in the chat.
There is a second, louder version of this problem that lands before publication rather than after. App Review checks for use of protected resources and rejects apps whose code accesses them with no purpose string, returning the notice ITMS-90683: Missing purpose string in Info.plist. That is a rejection rather than a crash, and the last question at the end of this page draws the line between the two.
Android’s version is milder in practice. Runtime permissions are requested while the app is running, and a denied permission is something the code is supposed to handle rather than something the system enforces at build time. When an Android app crashes on the camera screen, it is more often the code not handling a denial than the manifest being wrong.
Gap 4: a release build blocks the plain-HTTP calls a debug build allowed
This is the cleanest example of a release build behaving differently from a debug build, and it is worth understanding even if it is not your crash, because it explains why “it worked in debug” proves less than it feels like it proves.
Android’s network security configuration documentation, last updated 2026-06-11, states the default: “Starting with Android 9 (API level 28), cleartext support is disabled by default. Applications that require cleartext traffic can opt in to cleartext traffic.” If your API is served over plain http rather than https, a modern Android build refuses the request.
Cleartext itself is switched on or off by the cleartextTrafficPermitted attribute on the <base-config> or a <domain-config> element of that file, or on the manifest’s usesCleartextTraffic attribute. A debug build often gets a more permissive version of that config than the release build, either through a separate debug manifest or a debug variant of the file. The same document also describes a <debug-overrides> section, “Overrides to be applied when android:debuggable is "true", which is normally the case for non-release builds generated by IDEs and build tools,” and adds: “If android:debuggable is "false", then this section is completely ignored.” That section covers debug trust anchors rather than cleartext, but it shows the same shape: settings that exist only while the build is debuggable.
So whatever exemption your debug build was running under is switched off in your release build, by design, silently, at the moment you built for the store. Inspect the release variant’s actual config rather than assuming it matches the debug one. The config file itself lives at res/xml/network_security_config.xml and is wired in through the android:networkSecurityConfig attribute on the <application> element in the manifest.
The symptom is specific. The app launches, the first screens render, and then one feature that talks to your backend fails, either as a spinner that never resolves or as a crash in code that assumed the response arrived. Check the scheme on the API address the app is calling before you check anything else.
As of 16 August 2026 this section cites Android’s network security configuration only. iOS has its own transport rules, and this article does not cite a primary source for them, so nothing here should be read as describing iPhone behaviour.
Gap 5: minified code makes the crash unreadable, not always broken
Minification gets blamed for more crashes than it causes. What it reliably does is destroy your ability to read the crash report, which then looks like a new and worse problem.
On Android, native stack traces without class and function names are a symptom of missing symbols rather than missing code. Google’s crash documentation says that if you do not see class and function-level information in native stack traces, you may need to generate a native debug symbols file and upload it to the Google Play Console. That is a build configuration step, and it changes what the report shows rather than what the app does.
Apple’s version of the same problem is symbolication. Apple’s crash report documentation puts the consequence plainly: “Always symbolicate your crash report before sharing it, otherwise the report shows hexadecimal addresses instead of function names and line numbers, making diagnosis more difficult.”
Crash reports from TestFlight and the App Store contain identifiable symbol information automatically, but only if you included symbol information when you submitted the build. A build submitted without it produces reports full of hex addresses, which is why a founder looking at a real crash report can still learn nothing from it.
The practical version: if the crash report is unreadable, fix the report before you touch the code. Guessing at a stack trace made of memory addresses is not debugging.
Gap 6: the app they installed is not byte-identical to the one you uploaded
Rule this one out last, but know it exists, because it explains why “I tested that exact file” is not quite true on Android.
Google’s app signing documentation, last updated 2026-03-06, describes Play App Signing as using two keys, the app signing key and the upload key: “You keep the upload key and use it to sign your app for upload to the Google Play Store.” What happens next is the part most founders never see. “Google uses the upload certificate to verify your identity, and signs your APK(s) with your app signing key for distribution”. The same page notes that app bundles “defer building and signing APKs to the Google Play Store”, which is why Play App Signing has to be configured before you upload one.
The file on a customer’s phone was therefore built and signed by Google from what you sent, not copied from your machine. That is normal and it is not a bug. It only matters here for the check it implies: compare the version and build number shown in the crash report against what you actually uploaded. If those disagree, you are debugging a different release than the one you think you shipped. A rebuild that changes the signing key altogether is a separate incident with its own symptoms, and it presents as an upload rejection rather than a crash.
How to read the crash report on Google Play
As of August 2026, Play Console holds crash data for a published Android app at Monitor and improve, then Android vitals, then Crashes and ANRs. It shows only crashes from devices whose owners opted in to sharing diagnostics, the first thing to check when the console looks empty. Filter to foreground issues to see the crashes users actually experienced.
Google’s own documentation, read on 16 August 2026, gives the path in three steps:
- Open Play Console.
- Select an app.
- On the left menu, select “Monitor and improve > Android vitals > Crashes and ANRs”.
Two limits on that data are stated on the same page, and both explain an empty console. The first: “Data comes from Android devices whose users have opted in to automatically share their usage and diagnostics data.” Not every user does. A small launch can produce genuine crashes and no console entries at all. The second is a filter you control. Google describes using the “Issue visibility” filter and selecting only the issues that happen in the foreground, which is how you separate crashes a person actually watched happen from background noise.
Once you have an issue, the stack trace tells you two things. Android’s crash documentation, last updated 2026-05-19, describes them as the type of exception thrown, and the section of code where it was thrown, shown as “the class, method, file, and line number of the source file”, with each subsequent line showing the preceding call site. Google’s own example looks like this:
--------- beginning of crash
AndroidRuntime: FATAL EXCEPTION: main
Process: com.android.developer.crashsample, PID: 3686
java.lang.NullPointerException: crash sample
at com.android.developer.crashsample.MainActivity$1.onClick(MainActivity.java:27)
at android.view.View.performClick(View.java:6134)
at android.view.View$PerformClick.run(View.java:23965)
at android.os.Handler.handleCallback(Handler.java:751)
You do not need to read Java to use this. The exception type is java.lang.NullPointerException, which means something the code expected to exist was not there, which is what a missing configuration value looks like from the inside. The first line after the exception names your own package, com.android.developer.crashsample, and a file and line number in it. Lines that start with android. or java. are framework code. The topmost line naming your package is where your app was when it died. Send that one line to whoever is fixing it and you have saved them an hour.
Reading the report is also the difference between a crash you can fix and one nobody has any record of. The same logic applies to failures that never crash at all: an error that got recorded nowhere is the version of this problem that does not even give you a console entry to open. Publishing an AI-built app to Google Play in the first place has its own sequence, and this console is where you will spend the week after it.
How to read the crash report on the App Store, with or without a Mac
As of August 2026, Apple gives three routes to a crash report, and only one needs a Mac. App Store Connect’s App Crashes report shows counts by version and device but withholds data unless events exist from at least five users. The customer’s own device gives the fullest report. The Crashes organizer in Xcode is Mac only.
Route 1: App Store Connect, no Mac
The App Crashes analytics report, as Apple documented it on 16 August 2026, carries eight fields: Date, App Name, App Apple Identifier, App Version, Device, Platform Version, Crashes, and Unique Devices. Apple documents its availability as daily every day, weekly every Friday for the previous week, and monthly on the fifth day of the following month, with completeness “Within five days”.
The privacy note on the same page is the part worth reading twice: “Includes app crashes data from users who have opted to share their data with Apple and developers. Data is provided only when events exist from at least five users for the respective report.”
A founder with 40 downloads and three crashing users will see nothing here. That is the documented behaviour of the report. The crashes are real, App Store Connect is working, and the threshold simply has not been met.
Route 2: the customer’s device, no Mac
This is the fastest real crash report a non-developer can get, and it costs one message to the person whose phone crashed. Apple’s steps for iOS, iPadOS, tvOS, visionOS and watchOS apps, as documented on 16 August 2026, are:
- “Open the Analytics & Improvements section of Settings on the device.”
- “Tap Analytics Data.”
- “Locate the log for your app. The log name starts with
<AppBinaryName>_<DateTime>for crash reports, orJetsamEvent_<DateTime>for high-memory use crashes.” - “Select the desired log.”
- “Tap the Share icon, and select Mail to send the crash report as a mail attachment.”
Apple also notes that crash reports from watchOS are available on the paired iPhone. Ask the customer for the most recent log whose name starts with your app’s binary name, and you have the actual report rather than a description of what they saw.
Route 3: the Crashes organizer, Mac only
Apple’s documentation states that “The Crashes organizer presents crash reports from customers who share diagnostic and usage information”, which is the same opt-in limit Google has. There is one documented exception, and it is the single most useful fact on this page for a founder without a monitoring budget: “TestFlight users of your app automatically share crash reports with you, regardless of the device settings for sharing diagnostic and use data.”
That is a reason to keep a TestFlight build running after launch rather than shutting it down the day the app goes live. A handful of testers on the TestFlight track give you crash reports that the App Store track may never produce.
The trap: the crashes the organizer will not show you
Apple’s crash-report documentation, read on 16 August 2026, lists four crash report types that are not available through the Crashes organizer at all:
- Watchdog events, such as those from slow app launch times
- Invalid code-signature crashes
- Thermal events, where a device overheats because an app uses too much CPU
- Jetsam events, where an app has high memory use
The first of those is the one that matches “it closes right after it opens”. The operating system watches how long an app takes to become responsive and kills it if it takes too long. Apple’s guide to identifying common crashes shows what the resulting report looks like:
Exception Type:  EXC_CRASH (SIGKILL)
Exception Codes: 0x0000000000000000, 0x0000000000000000
Exception Note:  EXC_CORPSE_NOTIFY
Termination Reason: Namespace SPRINGBOARD, Code 0x8badf00d
The accompanying Termination Description names the specific transgression, in Apple’s own example a “scene-create watchdog transgression” that “exhausted real (wall clock) time allowance of 19.97 seconds”. Put those two facts together and you get a genuinely nasty combination: the crash type most likely to hit an app that loads too much on its first screen is also a crash type the organizer does not carry. A simulator on a fast laptop never reproduces it, and the Mac tool never shows it. Route 2, the log emailed off the customer’s phone, is how you see it.
Why build 9 will not fix it
Someone on r/replit described the position exactly: “My EAS build has been published to the Play store. After downloading, the app crashes…”
From there the pattern is always the same. Something crashes, a change goes out, a new build goes up, and nobody has read a crash report at any point. Each round through the public store costs a build, an upload, a review wait, and a day; a TestFlight or internal-testing build skips the public review, and still costs a build and a wait. The changes are guesses, and a guess that did not work tells you almost nothing about which of the six gaps you have. When an agent keeps reporting the problem as handled while the same failure keeps arriving, the loop itself has become the problem worth solving.
A rebuild without a crash report is a guess, and each guess pushed through the public store costs a review cycle to test.
Release-path weakness is common enough to measure. In AxonBuild’s dated June to July 2026 audit cohort, Deployment and Operations averaged 37.0 out of 100 across the 21 third-party apps, the third worst of twelve pillars. The limitation matters and is worth stating plainly: no store-published mobile app sits in that cohort. Those 21 are web and API projects. What the number describes is the release path itself, and the release path is what breaks here: builds nobody can reproduce, configuration nobody can list, and no record of what went out.
Reading one crash report is the shortest route out of that loop. Most of the time it points at one of the six gaps, and five of those are settings rather than code. When it points somewhere else, at a bug in the code itself, that is worth knowing before the next build too.
Common questions about an app that crashes after publishing
Why does my app crash on a real phone when the builder preview worked?
The preview and the store build are different artifacts. A preview usually runs a development build pulling JavaScript from a bundler and running with development exemptions switched on. The store build is compiled, distribution-signed, has its JavaScript baked in, and runs with those exemptions off. Configuration that lived only on your machine, a bundle that never got included, and a plain-HTTP call that a release build refuses are three causes worth checking early.
Why is my APK crashing after I install it from the Play Store?
One early possibility is that the binary is missing something that was present during development rather than that the code is wrong. Two versions worth checking are missing configuration values, which crash on the first screen that calls anything, and a build that shipped without its JavaScript bundle, which can crash instantly on launch across devices. React Native’s documentation warns that org.gradle.configureondemand=true in gradle.properties makes a release build skip bundling JavaScript and assets into the binary. Check the crash report in Play Console before changing code.
My Android app closes right after it opens. What is that usually?
A crash on launch, before the first screen finishes drawing, can mean the app could not start rather than that a feature failed. Three causes worth checking early are a missing JavaScript bundle in the binary, a configuration value the app reads immediately and does not find, or a first screen slow enough that the operating system killed it. On iOS that last case produces a watchdog termination, which Apple documents as Termination Reason: Namespace SPRINGBOARD, Code 0x8badf00d.
Do I need a Mac to find out why an iPhone app crashed?
No. Two of the three Apple routes work without one. App Store Connect’s App Crashes report shows crash counts by app version, device and platform version with no Mac involved. The customer whose phone crashed can email you the full crash report from Settings, under Analytics & Improvements, then Analytics Data, by selecting the log whose name starts with your app’s binary name and sharing it by Mail. Only the Crashes organizer in Xcode requires a Mac.
Why does the console show no crashes when users say the app crashes?
Because both stores withhold data by design, and both thresholds are documented. Google states that Play Console crash data “comes from Android devices whose users have opted in to automatically share their usage and diagnostics data”, so users who declined that prompt are invisible. Apple states that its App Crashes report provides data “only when events exist from at least five users for the respective report”. A new app with a few dozen installs can be genuinely crashing and show nothing in either console.
How long after publishing does crash data show up?
Apple documents the App Crashes report as available daily, with weekly instances every Friday for the previous week and monthly instances on the fifth day of the following month, and states its completeness as within five days. So a number you read today can still move. Google does not publish an equivalent completeness window on its crash and ANR help page. Neither store will show anything at all until enough users have both crashed and opted in to sharing.
Is a crash the same thing as an App Store rejection?
No, and the two need different fixes. A rejection happens before release, arrives as a message from App Review citing a guideline, and blocks publication until you respond. A crash on this page happened to an app that already passed review and is live on customers’ phones. If your app was rejected from the App Store, and you want to know which guideline was cited, that is the other problem. One overlap exists: an app that crashes during review gets rejected for it, so the same root cause can produce either outcome depending on when it fires.
Can I put the working version back while I fix this?
On Google Play, partly. If the broken version went out as a staged rollout, Google documents halting it: “If you discover an issue, you can halt a staged rollout to help minimize the number of users who experience the issue with your app”. Reverting to the previous version is not the documented path; Google’s instruction for a bad app bundle is to roll out a new release with a fixed one. As of 16 August 2026 this article cites no Apple primary source for the App Store equivalent, so treat the iOS side as unanswered here.
Fixing the bug in this guide gets you past today. If you would rather have the whole foundation checked and built in one go, that is what the sprint below is for.
Built it with AI. Now it has to hold up for real customers.
The Production Hardening Sprint takes the app you already have and builds the production foundation underneath it. Authentication and access rules, payments that stay consistent, error handling, monitoring, backups, automated tests and a documented handover. Our engineers work inside your existing codebase for ten working days. All 123 deliverables are included, and you get the evidence for each one.
See the Production Hardening Sprint →  $2,500 fixed price · 10 working days · One codebase